Download
1 / 23
230 likes | 323 Views
Plug-and-Play Macroscopes That Empower Science Katy Börner Cyberinfrastructure for Network Science Center, Director Information Visualization Laboratory, Director School of Library and Information Science Indiana University, Bloomington, IN katy@indiana.edu

E N D
Plug-and-Play Macroscopes That Empower Science Katy Börner Cyberinfrastructure for Network Science Center, Director Information Visualization Laboratory, Director School of Library and Information Science Indiana University, Bloomington, IN katy@indiana.edu With special thanks to the members at the Cyberinfrastructure for Network Science Center, the NWB team, the Sci2 team, the EpiC team, and all other teams that use OSGi/CIShell. Modeling and Mapping Science Workshop, Indiana University, Bloomington, IN March 21, 2011
Börner, Katy. (March 2011). Plug-and-Play Macroscopes. Communications of the ACM.
Many of the best micro-, tele-, and macroscopes are designed by scientists keen to observe and comprehend what no one has seen or understood before. Galileo Galilei (1564–1642) recognized the potential of a spyglass for the study of the heavens, ground and polished his own lenses, and used the improved optical instruments to make discoveries like the moons of Jupiter, providing quantitative evidence for the Copernican theory. Today, scientists repurpose, extend, and invent new hardware and software to create “macroscopes” that may solve both local and global challenges. The tools I will show you today empowerme, my students, colleagues, and 100,000 others that downloaded them. Designing “Dream Tools” 3
Decision making in science, industry, and politics, as well as in daily life, requires that we make sense of data sets representing the structure and dynamics of complex systems. Analysis, navigation, and management of these continuously evolving data sets require a new kind of data-analysis and visualization tool we call a macroscope (from the Greek macros, or “great,” and skopein, or “to observe”) inspired by de Rosnay’s futurist science writings. Macroscopes provide a “vision of the whole,” helping us “synthesize” the related elements and enabling us to detect patterns, trends, and outliers while granting access to myriad details. Rather than make things larger or smaller, macroscopes let us observe what is at once too great, slow, or complex for the human eye and mind to notice and comprehend. Macroscopes Microscopes Telescopes Macroscopes 4
Inspire computer scientists to implement software frameworks that empower domain scientists to assemble their own continuously evolving macroscopes, adding and upgrading existing (and removing obsolete) plug-ins to arrive at a set that is truly relevant for their work—with little or no help from computer scientists. While microscopes and telescopes are physical instruments, macroscopes resemble continuously changing bundles of software plug-ins. Macroscopes make it easy to select and combine algorithm and tool plug-ins but also interface plug-ins, workflow support, logging, scheduling, and other plug-ins needed for scientifically rigorous yet effective work. They make it easy to share plug-ins via email, flash drives, or online. To use new plugins, simply copy the files into the plug-in directory, and they appear in the tool menu ready for use. No restart of the tool is necessary. Sharing algorithm components, tools, or novel interfaces becomes as easy as sharing images on Flickr or videos on YouTube. Assembling custom tools is as quick as compiling your custom music collection. Goal of This Talk 5
Changing Scientific Landscape—Personal Observations Different datasets/formats. Diverse algorithms/tools written in many programming languages. Physics IS SNA CS Bio 6
Google Code and SourceForge.net provide special means for developing and distributing software In August 2009, SourceForge.net hosted more than 230,000 software projects by two million registered users (285,957 in January 2011); In August 2009 ProgrammableWeb.com hosted 1,366 application programming interfaces (APIs) and 4,092 mashups (2,699 APIs and 5,493 mashups in January 2011) Cyberinfrastructures serving large biomedical communities Cancer Biomedical Informatics Grid (caBIG) (http://cabig.nci.nih.gov) Biomedical Informatics Research Network (BIRN) (http://nbirn.net) Informatics for Integrating Biology and the Bedside (i2b2) (https://www.i2b2.org) HUBzero (http://hubzero.org) platform for scientific collaboration uses myExperiment (http://myexperiment.org) supports the sharing of scientific workflows and other research objects. Missing so far is a common standard for the design of modular, compatible algorithm and tool plug-ins (also called “modules” or “components”) that can be easily combined into scientific workflows (“pipeline” or “composition”), and packaged as custom tools. Related Work 7
OSGi & CIShell • CIShell (http://cishell.org) is an open source software specification for the integration and utilization of datasets, algorithms, and tools. • It extends the Open Services Gateway Initiative (OSGi) (http://osgi.org), a standardized, component oriented, computing environment for networked services widely used in industry since more than 10 years. • Specifically, CIShell provides “sockets” into which existing and new datasets, algorithms, and tools can be plugged using a wizard-driven process. Developers Users Workflow Alg Sci2 Tool CIShell Wizards CIShell Workflow Alg Alg Workflow NWB Tool Tool Workflow Tool
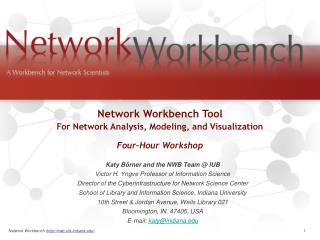
Scholarly Database: 25 million scholarly records http://sdb.slis.indiana.edu VIVO Research Networking http://vivoweb.org Information Visualization Cyberinfrastructure http://iv.slis.indiana.edu Network Workbench Tool & Community Wiki http://nwb.slis.indiana.edu Science of Science (Sci2) Tool and CI Portal http://sci.slis.indiana.edu Epidemics Cyberinfrastructure http://epic.slis.indiana.edu/ Science of Science Cyberinfrastructures 10
Network Workbench Toolhttp://nwb.slis.indiana.edu The Network Workbench (NWB) tool supports researchers, educators, and practitioners interested in the study of biomedical, social and behavioral science, physics, and other networks. In February 2009, the tool provides more 169 plugins that support the preprocessing, analysis, modeling, and visualization of networks. More than 50 of these plugins can be applied or were specifically designed for S&T studies. It has been downloaded more than 65,000 times since December 2006. Herr II, Bruce W., Huang, Weixia (Bonnie), Penumarthy, Shashikant & Börner, Katy. (2007). Designing Highly Flexible and Usable Cyberinfrastructures for Convergence. In Bainbridge, William S. & Roco, Mihail C. (Eds.), Progress in Convergence - Technologies for Human Wellbeing (Vol. 1093, pp. 161-179), Annals of the New York Academy of Sciences, Boston, MA.
http://sci2.cns.iu.edu http://sci2.wiki.cns.iu.edu 12
OSGi/CIShell powered tool with NWB plugins and many new scientometrics and visualizations plugins. Börner, Katy, Huang, Weixia (Bonnie), Linnemeier, Micah, Duhon, Russell Jackson, Phillips, Patrick, Ma, Nianli, Zoss, Angela, Guo, Hanning & Price, Mark. (2009). Rete-Netzwerk-Red: Analyzing and Visualizing Scholarly Networks Using the Scholarly Database and the Network Workbench Tool. Proceedings of ISSI 2009: 12th International Conference on Scientometrics and Informetrics, Rio de Janeiro, Brazil, July 14-17 . Vol. 2, pp. 619-630. Sci2 Tool – “Open Code for S&T Assessment” GUESS Network Vis Sci Maps Horizontal Time Graphs
Sci2 Tool Geo Maps Circular Hierarchy
Sci2 Tool: Algorithms See https://nwb.slis.indiana.edu/community Preprocessing Extract Top N% Records Extract Top N Records Normalize Text Slice Table by Line --------------------------------------------- Extract Top Nodes Extract Nodes Above or Below Value Delete Isolates --------------------------------------------- Extract top Edges Extract Edges Above or Below Value Remove Self Loops Trim by Degree MST-Pathfinder Network Scaling Fast Pathfinder Network Scaling --------------------------------------------- Snowball Sampling (in nodes) Node Sampling Edge Sampling --------------------------------------------- Symmetrize Dichotomize Multipartite Joining --------------------------------------------- Geocoder --------------------------------------------- Extract ZIP Code Modeling Random Graph Watts-Strogatz Small World Barabási-Albert Scale-Free TARL Analysis Network Analysis Toolkit (NAT) Unweighted & Undirected Node Degree Degree Distribution --------------------------------------------- K-Nearest Neighbor (Java) Watts-Strogatz Clustering Coefficient Watts Strogatz Clustering Coefficient over K --------------------------------------------- Diameter Average Shortest Path Shortest Path Distribution Node Betweenness Centrality --------------------------------------------- Weak Component Clustering Global Connected Components --------------------------------------------- Extract K-Core Annotate K-Coreness --------------------------------------------- HITS Weighted & Undirected Clustering Coefficient Nearest Neighbor Degree Strength vs Degree Degree & Strength Average Weight vs End-point Degree Strength Distribution Weight Distribution Randomize Weights --------------------------------------------- Blondel Community Detection --------------------------------------------- HITS Unweighted & Directed Node Indegree Node Outdegree Indegree Distribution Outdegree Distribution --------------------------------------------- K-Nearest Neighbor Single Node in-Out Degree Correlations --------------------------------------------- Dyad Reciprocity Arc Reciprocity Adjacency Transitivity --------------------------------------------- Weak Component Clustering Strong Component Clustering ---------------------------------------------
Sci2 Tool: Algorithms cont.See https://nwb.slis.indiana.edu/community -------------------------------- Extract K-Core Annotate K-Coreness -------------------------------- HITS PageRank Weighted & Directed HITS Weighted PageRank Textual Burst Detection Visualization GnuPlot GUESS Image Viewer --------------------------------------------- Radial Tree/Graph (prefuse alpha) Radial Tree/Graph with Annotation (prefuse beta) Tree View (prefuse beta) Tree Map (prefuse beta) Force Directed with Annotation (prefuse beta) Fruchterman-Reingold with Annotation (prefuse beta) --------------------------------------------- DrL (VxOrd) Specified (prefuse beta) --------------------------------------------- Horizontal Bar Graph Circular Hierarchy Geo Map (Circle Annotation Style) Geo Map (Colored-Region Annotation Style) Science Map (Circle Annotation) Scientometrics Remove ISI Duplicate Records Remove Rows with Multitudinous Fields Detect Duplicate Nodes Update Network by Merging Nodes --------------------------------------------- Extract Directed Network Extract Paper Citation Network Extract Author Paper Network --------------------------------------------- Extract Co-Occurrence Network Extract Word Co-Occurrence Network Extract Co-Author Network Extract Reference Co-Occurrence (Bibliographic Coupling) Network --------------------------------------------- Extract Document Co-Citation Network Soon: Database support for ISI and NSF data.
Converters Changing Scientific Landscape—Personal Observations Cont. Common algorithm/tool pool Easy way to share new algorithms Workflow design logs Custom tools TexTrend EpiC IS CS Bio SNA Phys NWB Sci2 19
OSGi/CIShell Adoption CIShell/OSGi is at the core of different CIs and a total of 169 unique plugins are used in the - Information Visualization (http://iv.slis.indiana.edu), - Network Science (NWB Tool) (http://nwb.slis.indiana.edu), - Scientometrics and Science Policy (Sci2 Tool) (http://sci.slis.indiana.edu), and - Epidemics (http://epic.slis.indiana.edu) research communities. Most interestingly, a number of other projects recently adopted OSGi and one adopted CIShell: Cytoscape (http://www.cytoscape.org) lead by Trey Ideker, UCSD is an open source bioinformatics software platform for visualizing molecular interaction networks and integrating these interactions with gene expression profiles and other state data (Shannon et al., 2002). Taverna Workbench (http://taverna.sourceforge.net) lead by Carol Goble, University of Manchester, UK is a free software tool for designing and executing workflows (Hull et al., 2006). Taverna allows users to integrate many different software tools, including over 30,000 web services. MAEviz (https://wiki.ncsa.uiuc.edu/display/MAE/Home) managed by Shawn Hampton, NCSA is an open-source, extensible software platform which supports seismic risk assessment based on the Mid-America Earthquake (MAE) Center research. TEXTrend (http://www.textrend.org) lead by George Kampis, Eötvös University, Hungary develops a framework for the easy and flexible integration, configuration, and extension of plugin-based components in support of natural language processing (NLP), classification/mining, and graph algorithms for the analysis of business and governmental text corpuses with an inherently temporal component. As the functionality of OSGi-based software frameworks improves and the number and diversity of dataset and algorithm plugins increases, the capabilities of custom tools will expand.
Acknowledgements • Micah Linnemeier and Russell J. Duhon Bruce W. Herr II, George Kampis, Gregory J. E. Rawlins, Geoffrey Fox, Shawn Hampton, Carol Goble, Mike Smoot, Yanbo Han for stimulating discussions and comments. • The Cyberinfrastructure for Network Science Center (http://cns.iu.edu), the Network Workbench team (http://nwb.cns.iu.edu), and Science of Science project team (http://sci2.cns.iu.edu) for their contributions toward the work presented here. • Software development benefits greatly from the open-source community. Full software credits are distributed with the source, but I would especially like to acknowledge Jython, JUNG, Prefuse, GUESS, GnuPlot, and OSGi, as well as Apache Derby, used in the Sci2 tool. • This research and development is based on work supported by National Science • Foundation grants SBE-0738111, IIS-0513650, IIS-0534909 and National Institutes • of Health grants R21DA024259 and 5R01MH079068. 21
References Börner, Katy, Chen, Chaomei, and Boyack, Kevin. (2003). Visualizing Knowledge Domains. In Blaise Cronin (Ed.), ARIST, Medford, NJ: Information Today, Volume 37, Chapter 5, pp. 179-255. http://ivl.slis.indiana.edu/km/pub/2003-borner-arist.pdf Shiffrin, Richard M. and Börner, Katy (Eds.) (2004). Mapping Knowledge Domains. Proceedings of the National Academy of Sciences of the United States of America, 101(Suppl_1). http://www.pnas.org/content/vol101/suppl_1/ Börner, Katy, Sanyal, Soma and Vespignani, Alessandro (2007). Network Science. In Blaise Cronin (Ed.), ARIST, Information Today, Inc., Volume 41, Chapter 12, pp. 537-607. http://ivl.slis.indiana.edu/km/pub/2007-borner-arist.pdf Börner, Katy (2010) Atlas of Science. MIT Press. http://scimaps.org/atlas Scharnhorst, Andrea, Börner, Katy, van den Besselaar, Peter (2011) Models of Science Dynamics. Springer Verlag. 22
All papers, maps, cyberinfrastructures, talks, press are linked from http://cns.slis.indiana.edu 23