Download
1 / 14
140 likes | 210 Views
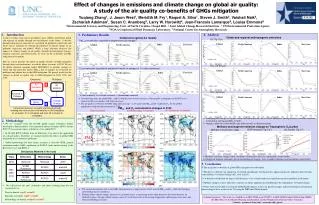
Assessing the Impacts of Changes in Climate and Emissions on Global Air Quality. Timothy Glotfelty 1 , Yang Zhang 1 , Shuai Zhu 1 , Prakash Karamchandani 2 , and David Streets 3 1 North Carolina State University , Raleigh, NC, USA 2 ENVIRON International Corporation, Novato, CA, USA

E N D
Assessing the Impacts of Changes in Climate and Emissions on Global Air Quality Timothy Glotfelty1, Yang Zhang1, Shuai Zhu1, Prakash Karamchandani2, and David Streets3 1North Carolina State University, Raleigh, NC, USA 2ENVIRON International Corporation, Novato, CA, USA 3Argonne National Laboratory, Argonne, IL, USA Presentation at the 11th Annual CMAS Conference, Chapel Hill, NC October 17, 2012
Motivations and Objectives • Importance • Climate Change (e.g., radiation, cloud properties) • Human Health (e.g., degraded air quality, exposure) • Ecological Stress (e.g., acid deposition, crop damage) • Objectives • Assess the impacts of projected climate and emissions on future air quality • Provide guidance in the development of future emission control and climate mitigation strategies • Projected Climate Change and Impacts from Past Studies • A warmer and more humid atmosphere with increased stagnation and a larger frequency of heat waves • Increase ozone levels but uncertain impacts on aerosols in the future
Model Configurations • Modeling and Set Up • Global WRF/Chem3.0 • Current Scenario (2001 and 2010) • Future Scenario (2020, 2030, 2040, and 2050) • Climate Change Only (2050) • Global (4o (lat)x 5o(lon) x 27 levels) • Emission Projection • IPCC SRES A1B Scenario • Growth Factors • IMAGE v. 2.2, Streets et al., 2004 (BC/OC) • Met. and Chem. IC • CCSM • GEOS-Chem • Emission Inventory • Offline Emissions for Major Species: MOZART4, CAM4, RETRO, NEI05, 2006 Asia EI, IPCC • Online Dust: Modified Shaw (2008) • Online Biogenic: MEGAN2 • Online Sea Salt: Modified Gong et al. (1997) • Performance Evaluation • Comprehensive Evaluation for Jan/Jul • Satellite and Surface Networks • (Zhang et al., JGR, 2012, in press) • Additional Evaluation for the Year 2001 • Meteorological • NCEP (T2), GPCP (Precip.), BSRN (SW and LW Radiation) • Chemical • MODIS (AOD and CCN), MOPITT (CO), GOME (NO2), TOMS/SBUV (TOR) • Physical/Chemical Options • Land Surface Model: NOAH • Boundary Layer: YSU • Cloud Microphysics: Purdue Lin • LongwaveRadiation: RRTM • Shortwave Radiation: Goddard • Cumulus: Grell-Devenyi • Gas Chemistry: CB05_GE • Aerosol Module: MADRID • Aqueous Chemistry: CMU • Aerosol Activation: Abdul Razzak-Ghan • Photolysis: F-TUV
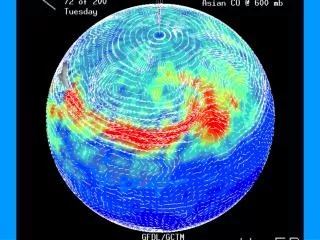
Meteorological Evaluation Model Evaluation 2001 • Chemical Satellite Column Evaluation
Projected Annual Mean Climate Change(Future – Current) GU-WRF/Chem CCSM T2 oC T2 oC Max: 2.1 Min: -0.8 Mean: 0.7 Max: 4.6 Min: -0.4 Mean: 1.0 Precipitation Rate mmday-1 Precipitation Rate mmday-1 Max: 4.6 Min: -2.4 Mean: 0.05 Max: 4.4 Min: -5.2 Mean: 0.01
Changes in Annual-Mean Climate and Optical Properties (Future – Current) T2 AOD COT • Climate • Warming (0.2-1.0 oC) • Variable precipitation change • Optics • Increased AOD and COT result in surface dimming Precip. ISWR
Annual Emission Trends (Future – Current) NOx NH3 mol km-2 hr-1 mol km-2 hr-1 Max: 12.8 Min: -1.3 Mean: 0.4 Max: 1.5 Min: -8.3 Mean: -0.05 POM 10-2μg m-2 s-1 AVOCs mol km-2 hr-1 Max: 2.0 Min: -1.8 Mean: -0.06 Max: 45.4 Min: -8.0 Mean: 0.7
Changes in Air Quality(Future – Current) Max 8-hr O3 ppbv • Maximum 8-hr O3 Mixing Ratio • Increases globally due to • Increased temperatures • Increased precursor emissions and subsequent transport Max: 20.4 Min: -0.2 Mean: 2.5 24-hr PM2.5 μg m-3 • 24-hr Average PM2.5 Concentration • Changes are regional • Decreases in West Africa (POM/BC), Europe (SO2), East Asia (POM/BC), and Eastern U.S. (SO2/NOx/BC/POM) • Increases in India (SO2/NOx), Southeast Asia (SO2/NOx/POM), South America (SO2/BC/POM), and Oceans (sea-salt) Max: 8.8 Min: -12.5 Mean: 0.3
Enhancement of Atmospheric Oxidation Capacity in JJA(Future – Current) SO2 Emissions SO2 Mixing Ratio mol km-2 hr-1 ppbv Max: 48.5 Min: -20.9 Mean: 0.3 Max: 17.1 Min: -4.7 Mean: 0.08 SO42- Concentration H2O2 Mixing Ratio ppbv μg m-3 Max: 1.7 Min: -0.2 Mean: 0.1 Max: 4.2 Min: -1.2 Mean: 0.1
Changes in Annual-Mean Total Deposition (g km-2 month-1) (Future – Current) • O3 • Increases due to increased O3 level • SO42- • Correlated with variability in precipitation • Total N • Mostly increasing (NOx) except over the Northern Hemisphere mid-latitudes (NHx) • Hg • Increases due to climate change, primarily from reduced dry deposition resistances O3 SO42- Total N Hg
Relative Impact of Projected Emissions vs. Climate Change (JJA, 2050 -2001) Climate Change and Emissions Climate Change Only Max 8-hr O3 ppbv Max 8-hr O3 ppbv O3 Max: 35.4 Min: -6.8 Mean: 3.6 Max: 7.5 Min: -6.6 Mean: -0.02 24-hr PM2.5 μg m-3 24-hr PM2.5 μg m-3 PM2.5 Max: 53.4 Min: -69.5 Mean: 0.8 Max: 17.7 Min: -6.6 Mean: 0.4
AOD COT Impact of Air Quality on Climate in JJA (2050 with Projected Emissions - 2050 Climate Change Only) Max: 0.4 Min: -0.1 Mean: 0.03 Max: 3.2 Min: -5.1 Mean: 0.08 Soil Temperature NetSolar Radiation Max: 1.7 Min: -2.0 Mean: 0.05 Max: 16.0 Min: -18.2 Mean: -1.1 2-m Temperature Downward Longwave Flux Max: 4.2 Min: -2.4 Mean: 0.1 Max: 19.3 Min: -16.3 Mean: 0.8
Conclusions • Air quality will be degraded in the future due to increases in O3, PM2.5 or both, which result from an increase in atmospheric oxidation capacity, and lead to greater pollutant deposition. • Increases in the PM level, as a result of either increased POM emissions or oxidation of precursors, will enhance the global AOD and COT, resulting in dimming at the Earth’s surface. • The relative contribution of projected emissions is much greater than that of projected climate change and can even offset the changes resulting from climate change. • The increased pollutant deposition could potentially lead to increased stress on future ecosystems and crops, while increased air pollutant concentrations could lead to enhanced health concerns, especially in the developing world. • This work demonstrates a need for cooperation among policy makers and scientists on a global scale to develop future emission control and climate mitigation strategies.
Acknowledgements • This work is supported by the U. S. EPA Science to Achieve Results Program Grant No. R833376 and the NSF/USDA Earth System Modeling Program Grant No. AGS-1049200 • Georg Grell at NOAA and Bill Skamarock at NCAR for technical discussions • Louisa Emmons and Francis Vitt at NCAR for providing the emission inventories used in MOZART4 and CAM4 • Christian Seigneur and Kristen Lohman, formerly at Atmospheric and Environmental Research, Inc., for providing global mercury emissions • Ralf Bennartz, University of Wisconsin – Madison, for providing CDNC data