Download
1 / 27
270 likes | 411 Views
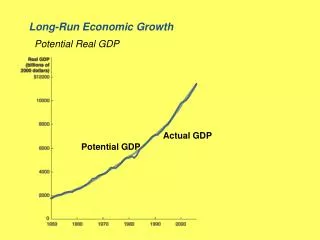
The Technical Component of Human Capital, Schooling and Long-Run Growth in 55 Countries, 1880-1990. Kirsten Labuske and Jörg Baten Department of Economics University of Tuebingen. Structure. Introduction. 1. Comparison with other samples. 2. Model and Data. 3. Results. 4.

E N D
The Technical Component of Human Capital, Schooling and Long-Run Growth in 55 Countries, 1880-1990 Kirsten Labuske and Jörg Baten Department of Economics University of Tuebingen
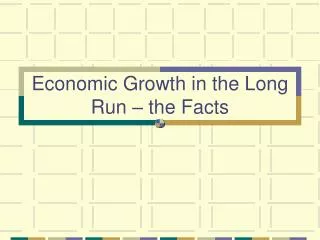
Structure Introduction 1. Comparison with other samples 2. Model and Data 3. Results 4. Impact on Long-Run Growth 5. Conclusions 6. 1
Introduction • 39,343 high value patents in Germany 1880-1913 • 9,300 were granted to foreigners from 38 nations • High value patents = 10-year prolonged • Annual renewal at the German patent office against an increasing fee • Germany – highest patent fee in the world 1852-1998 • Zero patents is also an important information 2 1. 3. 4. 2. 5. 6.
Main question Are the number of high-value patents in Germany a measure of the technical component of human capital? How correlated with schooling? Similar in other countries/other indicators? 3 1. 3. 4. 2. 5. 6.
110 4 0.05 11 Exhibits in 1851 and Patents per Capita 1885 4 1. 3. 4. 2. 5. 6.
Comparison of Patents per Capita in Germany and Spain 5 1. 3. 4. 2. 5. 6.
Generalaccordance between our new patent-based source and other sources • Deviations can be explained by: • Economic relations between Germany and the applicant country • Cultural similarities 6 1. 3. 4. 2. 5. 6.
Model Endogenous variable: • Schooling (linear and root specification) • Share of industries with high propensity to patent • Patent Laws • Geographical and cultural proximity Natural logarithm of patents per capita 1880-1914 (quinquennials) Exogenous variables: 7 1. 3. 4. 2. 5. 6.
Share in all high-value patents 1877-1913 (German patents included) 8 1. 3. 4. 2. 5. 6.
Share of patents in chemical and electrotechnical industries by country 9 1. 3. 4. 2. 5. 6.
Patents per Capita and Primary Schooling Rates 1900 11 1. 3. 4. 2. 5. 6.
Estimation Results:Determinants of log. Patents per capita 1880-1910. (unweighted) 13 1. 3. 4. 2. 5. 6.
Estimation results Impacts on foreign high value patents per capita (logarithm): • Lagged schooling rates - linear specification: significantly positive - root specification: significantly negative • Distance to Germany: significantly negative • German language: changing influence but mostly positive and insignificant • Patent Protection: positively (but not always significant) • Ratio of high patenting industries: positively (but not always significant) 16 1. 3. 4. 2. 5. 6.
Estimated Human Capital (basis: patents and schooling, measured as schooling equivalent)
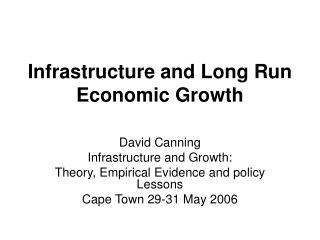
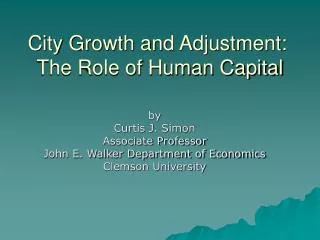
Impact on Long-Run Growth Is it possible to explain the rate of growth of GDP per capita as well as the long-run level of GDP per capita with our new patent- and schooling-based human capital variable? Long-run path-dependency of economic growth? 17 1. 3. 4. 2. 5. 6.
Estimation Results: Determinants of per Capita Growth 1950-55 18 1. 3. 4. 2. 5. 6.
Estimation Results: Determinants of per GDP per Capita 1950-85 19 1. 3. 4. 2. 5. 6.
Human Capital Formation 1910 and GDP per capita 1980 (all in logs)
Conclusions • Number of high value patents in Germany can be used as a measure of inventiveness • Correlation with enrollment shares in the countries of origin (component of Human Capital) corroborates this indicator • Interesting deviations: Finland, Balkans, Iberia, Netherlands • Positive influence of patent laws contradicts Moser (2003) • Strong positive effect of human capital (1910) on the growth rate (1950-55) and on the level (1950-85) of GDP per capita 20 1. 3. 4. 2. 5. 6.
Estimation Results:Determinantes of log. patents per capita 1880-1910. All countries included. (weighted by measurement quality) 1. 3. 4. 2. 5. 6.
Estimation Results:Determinantes of log. patents per capita 1880-1910. Only countries with patents greater zero. (unweighted) 1. 3. 4. 2. 5. 6.
Patents per Capita and Primary Schooling Rates 1880 10 1. 3. 4. 2. 5. 6.
Patents per Capita and Primary Schooling Rates 1910 12 1. 3. 4. 2. 5. 6.
Estimation Results:Influence of enrollment rates from preceding decades on log. Patents per capita 1910 14 1. 3. 4. 2. 5. 6.
Patents per Capita and Primary Schooling Rates 1910 15 1. 3. 4. 2. 5. 6.
Human Capital Formation 1910 and GDP per capita 1950 (all in logs)