Download
1 / 22
220 likes | 344 Views
Evaluation of GPM Precipitation Estimates for Land Data Assimilation Applications. Mississippi State University Geosystems Research Institute. GPM Evaluation Team & Collaborators. MSU Team Robert Moorhead Valentine Anantharaj Georgy Mostovoy Yangrong Ling QiQi Lu

E N D
Evaluation of GPM Precipitation Estimates for Land Data Assimilation Applications Mississippi State University Geosystems Research Institute RPC Review (03/02/09)
GPM Evaluation Team & Collaborators • MSU Team • Robert Moorhead • Valentine Anantharaj • GeorgyMostovoy • YangrongLing • QiQi Lu • Graduate students (2) • External Collaborators • Paul Houser (GMU CREW) • Joe Turk (Naval Research Laboratories & JPL) • Partner Agencies • Garry Schaeffer (USDA NRCS) • Steve Hunter (United States Bureau of Reclamation) RPC Review (03/02/09)
GPM Evaluations: Purpose and Activities RPC Review (03/02/09)
Purpose of RPC GPM Experiments • Evaluate usefulness of GPM data for decision support in water resources management and other cross-cutting applications. Test, characterize, and evaluate GPM data in conjunction with other precipitation products in the context of land surface modeling for earth science applications. RPC Review (03/02/09)
Experimental Objectives of GPM Evaluation • Verify space-based precipitation estimation using ground-based radar and rain gauge data for different cases representing different synoptic condition and surface types • Validate precipitation forcing impacts using land surface model simulations. • Evaluate potential impacts on water resources applications. RPC Review (03/02/09)
Satellite Omission Experiments RPC Review (03/02/09)
Motivation • Precipitation is the main forcing for hydrological and land surface models • Precipitation events that result in flooding often evolve over short space and time scales, where properly instrumented surface networks may not be available • Satellite data often provides the only source of timely precipitation data over many of the world’s remote watersheds • Hydrological modeling is a key focus of the future NASA/JAXA Global Precipitation Measurement Mission (GPM) in 2013; however • The members of the GPM constellation will change owing to launch schedules before and during the mission; therefore • How can we leverage today’s existing environmental satellite constellation to examine the impact of (existing and future) satellites and orbits on hydrological applications? NASA RPC Review (4/14/08)
Current (10-Satellite) LEO Satellite Constellation Revisit Time Color Codes: SSMI DMSP F-13/14/15 AMSR-E Aqua AMSU-B NOAA-15/16/17 TMI TRMM Coriolis Windsat SSMIS F-16 RPC Review (03/02/09) Revisit Scale: White= 0 hours Black= 6+ hours (shaded boxes represent 15-minute coverage)
Observing Times for an Ideal Precipitation-Based Low-Earth Orbiting Satellite Observing Constellation 0 Pattern progresses from day to day 18 6 12 Orbits are equally spaced with a 1.5 to 3-hour revisit time AscendingDescending RPC Review (03/02/09)
What We Have Today: DMSP and NOAA Satellites 0 0 F-16 NOAA-17 F-15 F-13 18 6 18 6 F-14 NOAA-15 NOAA-16 NOAA-18 12 12 NOAA Satellites as of Late 2006 AscendingDescending DMSP Satellites as of Late 2006 AscendingDescending RPC Review (03/02/09)
“Building Blocks” for HRPPs: NOAA/DMSP Satellites Late Summer 2008 Midnight TRMM 28-day repeat at equator NOAA-17 F16 F15 F13 Coriolis 6 PM 6 AM F17 NOAA-15 NOAA-16 F14 METOP-A NOAA-18 FY-3A (launched 29 May 2008) Aqua Noon Ascending Descending F14 only direct-broadcast since 24 Aug 2008 F18 launch date: 8 November 2008
Examining Impact of Satellite Type for the GPM Era Satellite Omission Experiments Case 0: All satellites included (baseline) Case 1: Omit all crosstrack sounders Case 2: Omit morning crosstrack sounders Case 3: Omit afternoon crosstrack sounders Case 4: Omit TRMM TMI and PR and Aqua Case 5: Omit TRMM PR only Case 6: Omit TRMM TMI only Case 7: Omit TRMM TMI and PR Case 8: Omit all morning satellites Case 9: Omit all afternoon satellites NASA RPC Review (4/14/08)
Examining Impact of Satellite Type for the GPM Era Satellite Omission Experiments: Baseline 24-hour accumulations ending 2007/06/29 12Z 12-hour accumulations ending 2007/06/29 12Z 6-hour accumulations ending 2007/06/29 12Z 3-hour accumulations ending 2007/06/29 12Z NASA RPC Review (4/14/08)
Seasonal Performance East of 100W Longitude (> 1 mm/day) summer winter Not much difference amongst sat-omission runs for the NRL-Blend “adjustment-based” HRPP technique Bias Green box illustrates largest performance impact is the omission of the morning overpass crosstrack sounders (“No AM XT” and “No AM” configurations) Equitable Threat Score Probability of Detection ALL Satellites Case NOAA 15/16/17/18 (crosstrack) METOP-A (crosstrack) DMSP F-13/14/16/17 (conical) Aqua (conical) Coriolis (conical, over water) TRMM TMI (conical), PR False Alarm Rate NOGAPS NWP model
Seasonal Performance West of 100W Longitude (> 1 mm/day) summer winter Generally less skill in winter months over western US “high altitude” region Larger bias and spread for both satellites and model, especially in summer months Higher false alarm rate for satellite-estimated, especially in winter months Bias Equitable Threat Score Probability of Detection “All Satellites” Case NOAA 15/16/17/18 (crosstrack) METOP-A (crosstrack) DMSP F-13/14/16/17 (conical) Aqua (conical) Coriolis (conical, over water) TRMM TMI (conical), PR False Alarm Rate NOGAPS NWP model
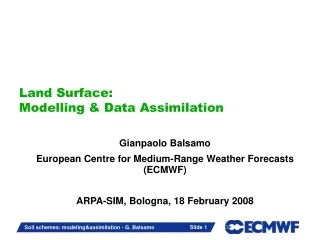
Using Land Surface Models for GPM Ground Validation Principle Use land surface models (LSM) and other types of hydrological observations (other than raingauge) to examine the impact of these GPM proxy data upon streamflow, discharge, soil moisture and other runoff measurements GPM Ground Validation • Experimental Setup • Incorporate the NASA Land Information System (LIS) with the NOAH LSM to simulate land surface and hydrological states • Examine performance impact of different GPM constellations (e.g, Gottschalk et. al, 2005)
Impact of GPM Precipitation Estimates Upon Land Surface Models The analysis domain below covers the south-central United States where there are several well-instrumented watersheds. The impact of precipitation in a LSM is dependent upon many physical factors, soil type, vegetation, etc. Soil moisture analysis at a given time is likely to be the cumulative result of precipitation that has fallen for weeks or months prior. To accommodate this, the results are shown after 5 months of simulation time, valid at 18 UTC on 31 October 2007. Soil moisture simulations are performed with 0.1o latitude x 0.1o longitude resolution and the North American Land Data Assimilation System (NLDAS) forcing fields (except for precipitation) are used to run the Noah LSM. Arkansas-Red River Basins Arkansas Cimarron The Arkansas River is the longest tributary in the Mississippi-Missouri system. From its source in Colorado, the river travels through Kansas and northeastern Oklahoma. There it is joined by the Canadian, Cimarron, Neosho-Grand, and Verdigris Rivers, crosses the state of Arkansas where it empties into the Mississippi River. Canadian Red
Satellite Denial Experiments: Effect on LSM No Crosstrack Sounders No AM Crosstrack Sounders No PM Crosstrack Sounders No TMI+PR+Aqua No AM Satellites No PM Satellites
Satellite Denial Experiments: Effect on LSM Example: Omit All Crosstrack Sounders Upper Layer (0-10 cm) Soil moisture difference relative to the “all-satellites” configuration Deep Layer (0.4-1 m) Valid at 18 UTC on 31 October 2007
Conclusions and Future Efforts Both the gauge-based verification analysis and the LSM satellite denial experiments indicate that the greatest impact to the “all satellites” GPM configuration appears when the crosstrack sounders and the morning crossing (LTAN near 1800) satellites are omitted. The removal of the morning satellites likely has less to do with the specific local time-of-day observation than it does with the fact that the bulk of the current (2008) satellites such as DMSP, Coriolis and several NOAA have early morning crossing times. While this example demonstrates only one time step, these LSM simulations are being extended to cover multi-year DJF and JJA seasonal analyses.
Summary of Progress • Completed Tasks • Synthesis of GPM-proxy data (based on NRL-blend algorithm) • Verification of precipitation products • Manuscript in draft, to be submitted to an AMS journal • Satellite Omission Experiments • Book chapter accepted (Springer Verlag) • Manuscript in final draft, to be submitted to IEEE-JSTARS • Final Steps (in progress) • Evaluation against USBR application metrics (soil moisture and evaporation) • Final evaluation (document and publish) Note: “verification” refers specifically to the satellite precipitation verification approach as used by the International Precipitation Working Group which is different from the systems engineering verification process defined by ASP. NASA RPC Review (3/2/09)
Contact InformationValentine Anantharaj<vga1@msstate.edu>Tel: (662)325-5135 RPC Review (03/02/09)