Download
1 / 15
150 likes | 1.17k Views
Cash Flow Analysis – Income Statement. Core Income Earnings from equity affiliates –––––––––––––––––––––––––––––––––––––– Operating Income (OI) + Non-operating income (Interest and dividends) ————————————————————————————— = Earnings Before Interest & Taxes (EBIT) - Interest Expense

E N D
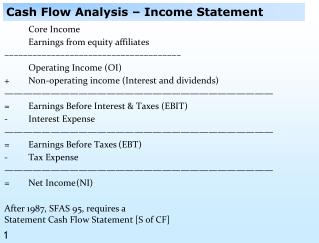
Cash Flow Analysis – Income Statement Core Income Earnings from equity affiliates –––––––––––––––––––––––––––––––––––––– Operating Income (OI) + Non-operating income (Interest and dividends) ————————————————————————————— = Earnings Before Interest & Taxes (EBIT) - Interest Expense ————————————————————————————— = Earnings Before Taxes (EBT) - Tax Expense ————————————————————————————— = Net Income (NI) After 1987, SFAS 95, requires a Statement Cash Flow Statement [S of CF]
Why Cash Flow Statements Cash Flow from Operations CFO Two Methods: Direct Method, Indirect Method Same bottom line value under both methods. Presentation different. Cash Flow from Investing CFI Cash Flow from Financing CFF Same presentation and value. Total Cash Flow number ––––––––––––––––––––––––––––––––––––––––––––––––– With no change in tax accounting methods Is total Cash Flow number affected by accounting methods? Yes / NO e.g. Revenue Recognition, Depreciation methods
Net income to CFO – 3 types of adjustments Net Income 1. - Noncash revenues e.g. Credit sales - Collections from past = in Receivables + Noncash expenses e.g. Depreciation –––––––––––––––––––––––––––––––––––––––––––– 2. - Nonoperating gains & losses e.g. Subtract gains from property sales ––––––––––––––––––––––––––––––––––––––––––– 3. - Increase in operating assets e.g. Prepaid assets –––––––––––––––––––––––––––––––––––––––––––– = CFO
CFI, CFF Cash Flow Statement [S of CF] ——————————————————————————————— - Purchase of PP&E - Net New Investments = CFI ————————————————————————————— - Net Debt Repaid - Dividends + Stock sales - Stock repurchases = CFF ————————————————————————————— CFO + CFI + CFF = Increase in cash = Total Cash Flow
Reported versus Operating changes Acquisitions and Divestitures Inventory may increase due to Where shown ? ––––——––––––––––––––––––––––––––––––––––––––––– » Purchase of inventory from a supplier CFO / CFI » Acquisition of a firm with inventories CFO / CFI Translation of foreign subsidiaries Balance sheet reflects changes in exchange rates. S of CF does not. Effects of exchange rate changes on cash - Directly reported
Direct vs. Indirect Method » Operating cash flows by function not available in the indirect method. » For a good FSA, recasting of the direct method CFO to an indirect method CFO may be of value Is CFO < = > Net Income over the long run? CFO generally higher as CFO does not include cost of capacity Page 89 - examples
Cash Flow Classification Issues What is the most important CF item? +; - ; 0 CFO or CFI or CFF ——————————————————————————————— Costs for replacement of capacity - ignored in CFO Which firm with same operations have lower CFO Leasing firm or Borrowing (and buying) firm? Leasing firm: CFO (-) rental expense (operating lease) Borrow & Buy firm: CFO ( ); CFI ( ); CFF ( ); Total same. ——————————————————————————————— Interest paid is CFO under SFAS 95. Not accurate as capital structure affects CFO – highly leveraged firms will have lower / higher CFO
Accounting Methods and Cash Flow Accounting methods can; can not; can can / can NOT cause Income differences. can / can NOT cause CF differences. can / can NOT cause CF classification differences. e.g. Capitalization of Software costs increases / decreases CFO increases / decreases CFI
Free Cash Flow to the firm = Cash from operations (CFO) - the amount of capital expenditures required to maintain the firm’s present productive capacity. + Interest Expense x (1 - Tax Rate) ––––––––––––––––––––––––––––––––––––––––––––Useful in many valuation models and mergers and acquisitions analysis. ––––––––––––––––––––––––––––––––––––––––––––Free Cash Flow = CFO - (- CFI + Other Investment) + Interest Expense x (1 - Tax Rate) = CFO + CFI + Other Investment + Interest Expense x (1 - Tax Rate)
Free Cash Flow CFO + CFI + CFF = Increase in cash CFO + CFI = Increase in cash - CFF Free Cash Flow = Increase in cash - CFF + Other Investment + Interest Expense x (1 - Tax Rate) ——————————————————————————————— So free cash flow is the amount left for • Increase in Cash • Payments to investors [-CFF + Interest Expense x (1 - Tax Rate)] • Acquisitions
NOPAT Net Income = [EBIT - Interest Expense] x [1 - Tax Rate ] rearranging terms EBIT x [1 - Tax Rate ] = Net Income + Interest Expense x [1 - Tax Rate ] Net Operating Profit After Taxes = NOPAT = EBIT x [1 - Tax Rate ] – Non-operating Profit after taxes If EBIT = operating income
Free Cash Flow – three ways CFO Net Income NOPAT + Depreciation + Depreciation - Increase in - Increase in Working Capital Working Capital + Net Interest Exp + Net Interest Exp [1 - Tax Rate ] [1 - Tax Rate] - Purchase of - Purchase of - Purchase of PP&E PP&E PP&E
Cash Flow – Tax benefit of options – Where 2 Operations or ______ See articles: Options Rule Could Hit Cash Flows Stock Options Pad Cash Flow Of Soaring Technology Issues
Lucent Last Trade: 2.25; 52wk Range: 1.99 - 3.49 Volume: 91,212,000; Avg Vol (3m): 44,304,300 Market Cap: 10.08B; P/E (ttm): 18.75; EPS (ttm): 0.12