Download

1 / 32
780 likes | 3.98k Views
Nonlinear mixed effects models in pharmacokinetic modeling. Lecture notes. Pharmacokinetics : Traditional , standard two-stage * approach. Recruit subjects from a homogenous (healthy?) population. Collect lots of blood samples from each patient.

E N D
Nonlinear mixed effects modelsin pharmacokinetic modeling Lecturenotes
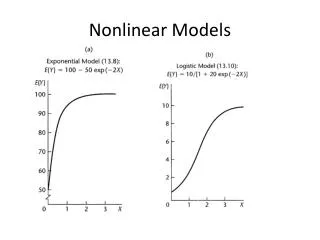
Pharmacokinetics: Traditional, standardtwo-stage* approach Recruit subjects from a homogenous (healthy?) population. Collect lots of blood samples from each patient. Estimate pharmacokinetic parameters for each patient separately. Calculate means and variances for pharmacokinetic parameters. Use regression to investigate the effects of covariates. ** *Not to be confused with the term ”two-stage estimation procedures” in statistics ** Riviere, J. Comparative Pharmacokinetics: Principles, Techniques and Applications, page 260. Iowa State Press, 1999.
Problemsassociatedwith the traditionalapproach: Parameter variabilities are inflated.* Since recruitment is usually done from a homogenous (healthy?) population, it is harder to extrapolate into target population. Difficult to study special populations who would not handle the blood loss well (neonates, AIDS/cancer patients, critical care patients, etc). *Sheiner LB, Beal SL. J Pharmacokinet Biopharm. 1980 Dec;8(6):553-71.
A solution: populationpharmacokinetics ( = Pharmacokinetics using nonlinear mixed effects modeling) • Build a pharmacokinetic model with fixed effects, between-subject variabilities, and residual variabilities. • Differences to traditional pharmacokinetic modeling: • One model explains all data • Between-subject variability is included in the model as a new kind of parameter: A random effect that varies between patients but stays constant within the patient.
Advantages of a population approach to pharmacokinetics 1/2 • Less blood samples per patient are needed • Special patient groups can be studied (children, cancer patients, etc) • Samples taken during routine treatment can be used in studies. • Cost-effectiveness increases • The results naturally reflect the patient group that is usually receiving the drug.
Advantages of a population approach to pharmacokinetics 2/2 Because data are combined into a single model, more detailed models can be used. E.g. nonlinearity can be detected better than with standard two-stage approach* Easier to design future clinical trials with one single model. *EN Jonsson, JR Wade, MO Karlsson. AAPS PharmSci. 2000;2(3):E32
Advantages of a population approach to pharmacokinetics: an example • Docetaxel, a chemotherapeutic agent • Main problem: Patients with poor liver function • FDA: do not dose due to unpredictable PK! • Aim: Build a clinically relevant model to predict docetaxel clearance in patients with poor liver function. Evaluate CYP3A activity spesifically as a predictor of docetaxel clearance. • A population PK model was built with following covariates: • Liver functioning classification based on a few markers • Plasma protein binding • CYP3A liver enzyme activity • After these covariates had been accounted for, the unexplained variability in clearance actually became lower for patients with poor liver function than with normal-liver-function patients. Hooker et al. Clin Pharmacol Ther. 2008 Jul;84(1):111-8.
Using the parameters of NLME models in pop-PK • Fixed-effects parameters (Thetas, θ) • Can be for example a typical value for volume of distribution, typical value for clearance or the effect of a covariate (e.g. sex) on a parameter. • A capital theta (Θ) denotes a vector of all fixed-effects parameters in model. • A lowercase theta (θ) denotes an element of Θ, one specific parameter.
Using the parameters of NLME models in pop-PK • Between-subject variability (Etas, η) (Empirical Bayes Estimates) • These describe unexplained differences in parameter values between individuals. • E.g. the individual value for clearance could be described as θCL*eη(CL). • Can also be used to describe inter-occasion variability, between-study variability. • It is expected that etas are distributed N(0, ω2)
Using the parameters of NLME models in pop-PK • Residual random effects (Epsilons, ε) • The unexplained residual error (different for each observation). • Sources: Misrecording the time of sampling, mistreatment of samples, error induced by analytical methods, model misspesification, etc. • It is expected that epsilons are distributed N(0, σ2) • E.g. observation=prediction+ε
In summary: The population model yij=f(Θi)+εij Where yij is the jth observation of ith individual f is a model that describes all observations Θi is a vector of individual i’s parameter values εij is residual error of individual i’s jth observation The elements of Θi are usually θi= θ*eη, where θ is the typical value for a parameter ω2 is the variance of η values
Components of a populationpharmacokineticmodel Fixed effects Mostly random effects
A hypotheticalexample: Building a 2-compartment model Let’ssaywehavepharmacokinetic data from 40 individuals, of which 20 receivedoraldosing and 20 receivedintravenousinjection. A total of 200 plasma concentrations, 2-8 per individual Knowncovariates: Weight, sex (SEX=0 to indicatemale, SEX=1 to indicatefemale) Thisexampletakesmanyshortcuts and shouldnotbeviewed as a reference of how to build a pop-PKmodel.
Let’sstartbybuilding a single-compartment IV model (and ignore the oraltreatmentgroup for now) • We use three parameters: • Volume of distribution for central compartment (V)= θV • Clearance (CL) = θCL • Residual error (with standard deviation σ) • The starting amount (A) in central compartment is Dose. After dosing, amount (A) of drug in central compartment starts to get eliminated. • At0=Dose • dA/dt=-A*CL/V • IPRED=A/V • The prediction (PRED) is compared to observation (Y) • Y=IPRED+ε ;σ is standard deviation ;of all epsilons
The model failed to converge. Let’s add between-subject variabilities to CL and V. We estimate five parameters: V= θV*eη(V);Volume of distribution and BSV for it CL= θCL*eη(CL);Clearance and BSV for it Residual error (σ) At0=Dose dA/dt=-A*CL/V IPRED=A/V Y=IPRED+ε ; σ is standard deviation ;of all epsilons …Success! The model now converges.
The ”weighted residuals vs time” graph hints that a 2-compartment model might perform better. On the left: WRES vs Time. Notice the red line (locally weighted scatterplot smoothing) starting above zero, falling below and rising back above zero. Below: An illustration of what it usually means if WRES vs time has a shape like that on the left. The black line represents predictions and red dotted line represents observations.
Let us try the two-compartment model. Vcentral= θV*eη(V) Vperipheral= θV2 ;Peripheral compartment volume Q= θQ ;Intercompartmental clearance CL= θCL*eη(CL) At0,central=Dose dAcentral/dt=-Acentral*CL/Vcentral– Acentral*Q/Vcentral + Aperiph*Q/Vperiph dAperiph= Acentral*Q/Vcentral – Aperiph*Q/Vperiph IPRED=Acentral/Vcentral Y=IPRED+ε
Let us tryaddingweight as a covariate into the modelnow. When adding covariates, we should also check if all the BSV’s are still necessary. It might be that covariates can explain most of the between-subject variability. Vcentral= θV*(WT/70)*eη(V) ; Linear scaling Vperipheral= θV2*(WT/70) Q= θQ CL= θCL*(WT/70)θscale*eη(CL) ; Allometric scaling At0,central=Dose dAcentral/dt=-Acentral*CL/Vcentral – Acentral*Q/Vcentral + Aperiph*Q/Vperiph dAperiph= Acentral*Q/Vcentral – Aperiph*Q/Vperiph IPRED=Acentral/Vcentral Y=IPRED+ε
Is sex a covariate? Let’s find out (remember, SEX=0 for male, SEX=1 for female). The testing of covariate relationships should be done one at a time. In this example we didn’t find any significant improvement when adding sex as a covariate in any of the parameters. Vcentral= θV*(WT/70)*(1+SEX*θsex1)*eη(V) ;affects only ;females Vperipheral= θV2*(WT/70)*(1+SEX* θsex2) Q= θQ CL= θCL*(WT/70)θscale* (1+SEX* θsex3)*eη(CL) At0,central=Dose dAcentral/dt=-Acentral*CL/Vcentral – Acentral*Q/Vcentral + Aperiph*Q/Vperiph dAperiph= Acentral*Q/Vcentral – Aperiph*Q/Vperiph IPRED=Acentral/Vcentral Y=IPRED+ε
Oncesatisfiedwith the IV model, weadd the oraltreatmentgroup Ka= θKa ;Rate of absorption F= θF ;Oral bioavailability Vcentral= θV*(WT/70)*eη(V) Vperipheral= θV2*(WT/70) Q= θQ CL= θCL*(WT/70)θscale*eη(CL) At0,depot=F*Doseoral At0,central=DoseIV dAdepot/dt= - Adepot*Ka dAcentral/dt= -Acentral*CL/Vcentral – Acentral*Q/Vcentral + Aperiph*Q/Vperiph +Adepot*Ka dAperiph= Acentral*Q/Vcentral – Aperiph*Q/Vperiph IPRED=Acentral/Vcentral Y=IPRED1+ε
Another example: Modeling flurbiprofen pharmacokinetics in children (real case) Data from 64 patients, 1-7 samples per patient Oral dose given to 37, intravenous dose to 27 patients.
Flurbiprofen pharmacokinetics: At the beginning… Observations of flurbiprofen CSF concentrations (60), and observations of both total (304) and unbound (62) flurbiprofen concentrations in plasma Prior knowledge: The doses given for each patient and the volume of CSF compartment.
Flurbiprofen pharmacokinetics: What we ended up with • All the parameters were estimated to best describe concentrations in central compartment and CSF. The number of parameters in the final model was: • 13 fixed-effect parameters • 4 between-subject variability parameters • 2 residual error variability parameters
Flurbiprofen pharmacokinetics: Most significant findings • Bioavailability of oral flurbiprofen syrup for children was estimated. • The model includes children from 3 months to 13 years (previous study: children aged 6-12 years). There was no impairment of clearance seen in infants. • Flurbiprofen distributes into cerebrospinal fluid very effectively.
Conclusion • With flurbiprofen data, population pharmacokinetic approach yielded several benefits: • Estimating bioavailability of oral flurbiprofen syrup was made possible. • More credibility when describing CSF kinetics with model parameters than with a summary of raw data (e.g. mean ratio of unbound flurbiprofen in plasma versus flurbiprofen in CSF). • More thoroughly investigated covariate model. • Only one model: Possible to use in simulations in future.
Resources • NONMEM. Currently the ”golden standard” in population pharmacokinetic modeling. Requires license. • http://www.icondevsolutions.com/nonmem.htm • Xpose: An R package that helps in deciphering the output of NONMEM. Free. • http://xpose.sourceforge.net/ • R: A program needed by Xpose to operate. Free. • http://www.r-project.org/ • Census. A helpful program for keeping record of NONMEM runs. Free. • http://census.sourceforge.net/ • PsN (Perl-speaks-Nonmem). A collection of helpful Perl scripts for NONMEM that make life easier in a lot of ways. Free. • MONOLIX. Another population pharmacokinetic program. Free. • Advantages: Shorter runtimes than in NONMEM, provides also graphical output by itself • Disadvantages: Currently not as flexible as NONMEM. • http://software.monolix.org/sdoms/software/
EXTRA: An example of simulatory model diagnostics: Visual Predictive Check • Using the model parameters (including random effects), simulate a number of observations, e.g. 200 simulated observations for every true observation. • Calculate the prediction intervals for these simulated observations • -> see if they agree with real observations. • Blue dots: Real observations • Black lines: 95th percentile prediction intervals • In this text, prediction interval means an interval, inside which a certain percentile of simulated observations fall.
EXTRA: An example of simulatory model diagnostics: Visual Predictive Check Usually a better alternative is to plot confidence intervals for prediction intervals and see if the intervals for real observations fall inside the confidence intervals for prediction intervals. Red lines: Intervals of real observations Blue area: Confidence intervals for prediction intervals
EXTRA: Features of the flurbiprofen model:Intravenous infusion The intravenous dosage had to have an absorption rate constant. The reason for this is that the intravenously given drug is a prodrug and takes some time to hydrolyze into active flurbiprofen (see figure below).
EXTRA: Features of the flurbiprofen model:Implementing unbound observations • Central compartment included two kinds of observations: • Total flurbiprofen concentrations • Unbound flurbiprofen concentrations • If the observation was marked as unbound observation, the prediction was multiplied by fraction unbound (FU) before it was compared to the observation. • FU= θFU*eη(FU) • … • IPRED=A(2)/V2 ;TOTAL • IF (FLAG.EQ.3) IPRED=A(2)/V2*FU ;UNBOUND
EXTRA: Features of the flurbiprofen model:CSF kinetics Modeling the distribution of flurbiprofen into CSF was challenging. Only unbound flurbiprofen can enter CSF. However, in CSF the concentrations of flurbiprofen were circa sevenfold compared to unbound flurbiprofen in plasma. This happened probably because of protein binding in CSF (the CSF observations reflect the total amount of flurbiprofen in CSF).
EXTRA: Features of the flurbiprofen model:CSF kinetics An intercompartmental clearance QCSF was estimated to describe the movement between central compartment and cerebrospinal fluid (CSF). The rate from central to CSF was adjusted by fraction unbound and an uptake factor (UPTK). QCSF= θQCSF UPTK= θUPTK K25=QCSF*FU/V2*UPTK K52=QCSF/V5 ;K25 and K52 represent rate constants from ;central compartment to CSF and from CSF to ;central compartment