Download
1 / 6
60 likes | 169 Views
Analysis of chip with 100 events, July 2001. Variation in pixel to pixel average ADC values (fixed pattern noise) Pixel ADC value event to event repeatability (reset noise) Bad frames were identified and removed

E N D
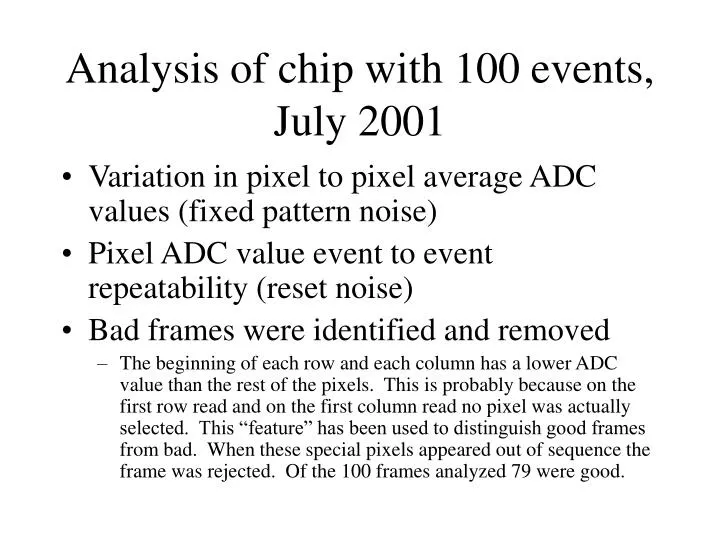
Analysis of chip with 100 events, July 2001 • Variation in pixel to pixel average ADC values (fixed pattern noise) • Pixel ADC value event to event repeatability (reset noise) • Bad frames were identified and removed • The beginning of each row and each column has a lower ADC value than the rest of the pixels. This is probably because on the first row read and on the first column read no pixel was actually selected. This “feature” has been used to distinguish good frames from bad. When these special pixels appeared out of sequence the frame was rejected. Of the 100 frames analyzed 79 were good.
Mean ADC values for all the pixels column # Mean ADC values show the fixed pattern noise. There is no apparent spatial structure other than the edge effects, no difference for rows or columns, appears random. row # sigma of mean = 36 ADC counts (edges excluded) Note the clear pixel in the 1st row 2nd column. This pixel has exactly the same value (32768) in every frame. Also the second row is different than the remaining rows in that that reads of columns 1st and 2nd appear disconnected instead of just the 1st column.
column # row # Standard deviation of pixel ADC values, reset noise (KTC) + other? view along columns There are some columns with apparently higher noise. As shown in following slides this is primarily due to outliers on the high ADC side. view along rows
ADC histogram for selected pixels (bin width 1 ADC count) Typical pixel sigma = 4.9 ADC cts Noisy pixel sigma = 9.6 ADC cts
ADC histogram for pixels in noisy column To view all of the histograms in the noisy column switch to slide mode and display this slide. There is an avi file in this directory if you want to view these in a more controlled manner. As you see the excess sigma is caused by a few outliers at high ADC values. This is again fortunate because real signals will be expected on the other side of the peak, at low ADC values.
More on event by event pixel repeatability The sigmas for all the pixels excluding edges were averaged. Resulting average pixel sigmas: (no cuts) sigma = 5.3 ADC counts sigma = 4.8 ADC counts (outliers > 16 from center removed) Conclusion: bad frame rejection removes most of the problems. The expected signal is 100 ADC counts, so we should be able to use the detector as is to see MIPs and proceed with other studies