Download
1 / 16
160 likes | 165 Views
This analysis examines the trends and disparities in concentrated poverty and regional equity using data from the 2000 Census to the 2005/09 ACS. It explores the conditions in low-income neighborhoods and the changes in composition over time. The analysis also looks at the disparities between low- and higher-income neighborhoods and discusses potential policy implications.

E N D
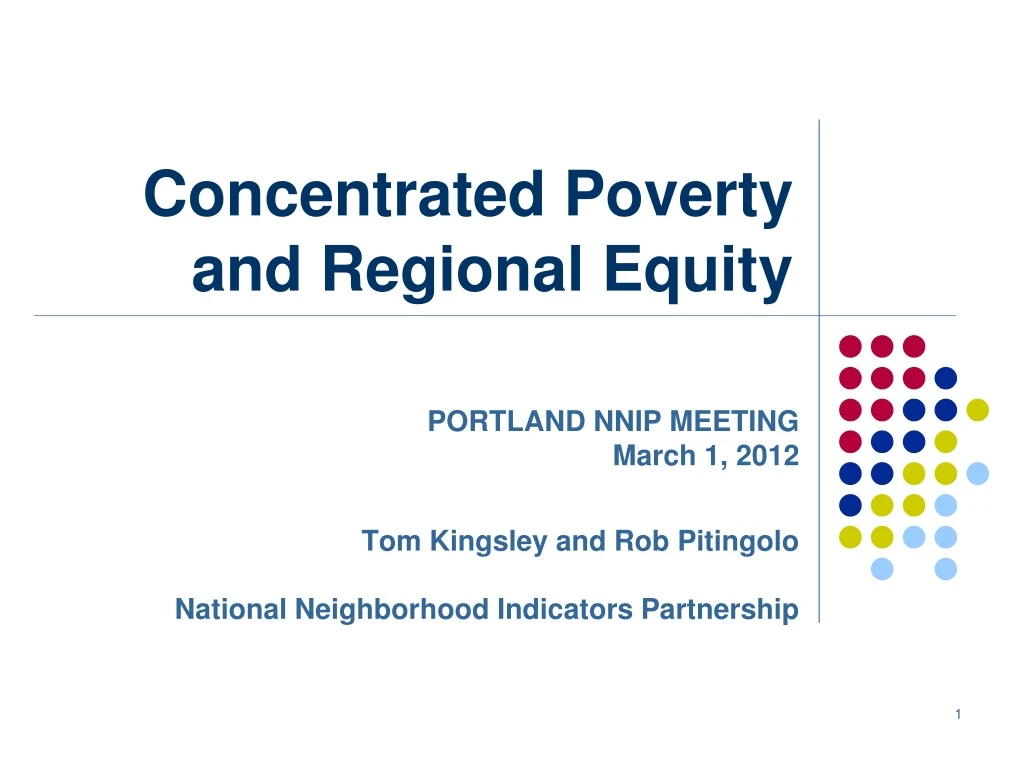
Concentrated Poverty and Regional Equity PORTLAND NNIP MEETING March 1, 2012 Tom Kingsley and Rob Pitingolo National Neighborhood Indicators Partnership
NNIP SHARED INDICATORS • The Shared Indicators agenda • Completed framework paper, indicator selection • Have national data now; plan assemble local data next few years • Chicago/Minneapolis partners working on system & protocols for collection (McKnight grant) • Using national data for first analysis • National analysis 100 largest metros (UI) • Analysis for individual metros by partners
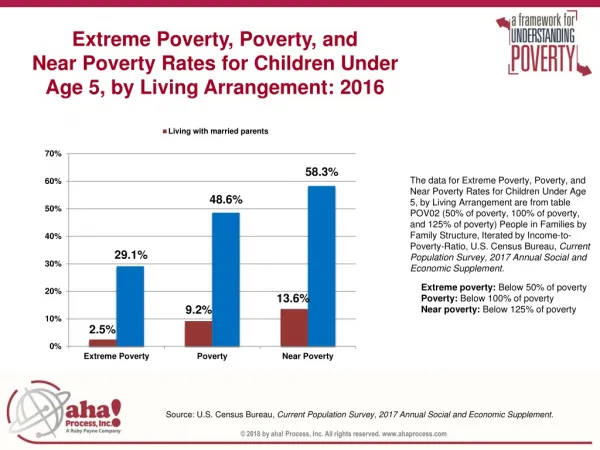
THIS ANALYSIS • 2000 Census to 2005/09 ACS • Imperfections: period and sample size • Concentrated poverty • Low income neigh. defined as >20% poverty • Conditions low-income neighborhoods • Taking into account composition change • Regional equity (disparity gaps) • Between low- and higher-income neighborhoods
Concentrated Poverty Went Up 48 47 24 21 Tracts Poor Population
Huge variation across metros – level and change in concentrated poverty
Except for income, indicators in low income neigh. improved modestly
But composition changed – some tracts improved, some worsened
Overall condition changes, in part due to shifts in composition
In Cleveland, city tracts more likely to improve, suburban tracts more likely to worsen
Changes in tracts that stayed low income throughout the period – modest differences in results
Large disparities (gaps): low- vs. higher-income neighborhoods
Small changes to gaps, 2000-2005/09Some narrowed, some widened Ave Income ($000) % Homeowners % Access to Car % LF Employed % College Degree
Regional disparity, not closely correlated with concentrated poverty
Next Steps • Analyze/present standard errors • Examine variations with metro size • Explore developing an overall disparity index • More indicators; z-scores to normalize • Examine contrasts between metros • More maps – varying change trajectories • Consider policy implications