Interactive Data Visualization for Analytics
Visualization tools allow for more intuitive analysis of complex data,Interactivity and predictive analytics enhance decision-making and analysis.

Interactive Data Visualization for Analytics
E N D
Presentation Transcript
Interactive Data Visualization for Analytics • www.qlx.com
Empower Your Decision-Making with Data Visualization • Visualization tools allow for more intuitive analysis of complex data • Interactivity and predictive analytics enhance decision-making and analysis. • Bridge the gap between data exploration and actionable insights www.qlx.com
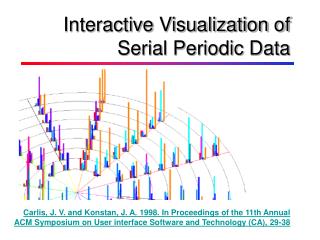
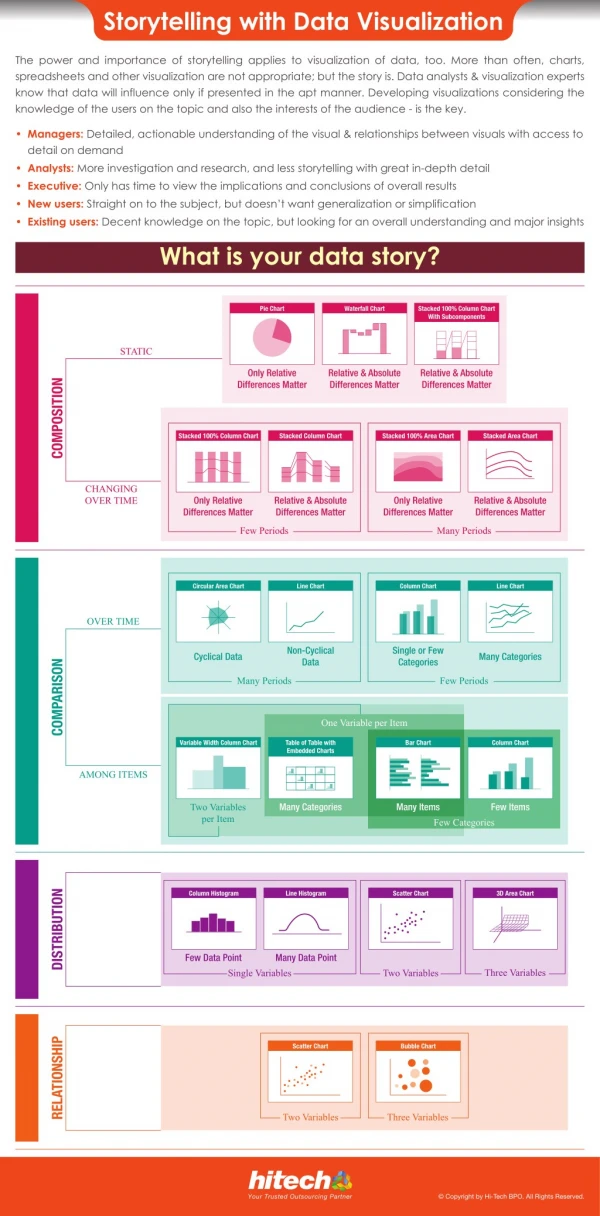
Key Features of Interactive Data Visualization • 3-D scatter plots, bubble plots, and trellis plots. • Dynamic interaction with data tables for real-time insights • Visual queries for filtering and rearranging data www.qlx.com
Advantages of Interactive Visualization • Faster analysis with in-memory processing for immediate feedback. • Multithreaded technology to handle large data sets seamlessly • No restrictions on table size—optimized for system resource www.qlx.com
Seamless User Experience • Create custom analyses through an extendable interface • Point-and-click interface for easy navigation and customization. • Built-in analytics tools provide powerful insights without coding www.qlx.com
Comprehensive Analytical Tools • Regression, variance, and survival analysis. • Nonlinear modeling and time series analysis • Tools for handling missing data, clustering, and more. www.qlx.com
Visual Interactivity • Interact directly with graphics, such as scatter plots and line charts. • Brush, highlight, and filter data for more precise analysis. • Real-time linkage between graphs and statistics for deeper insights. www.qlx.com
Enhancing Productivity • Visualize large datasets instantly without waiting for disk transfers • Multi-core processing ensures faster data interaction. • Keep all data in memory for smooth performance and faster results www.qlx.com
Compliance and Documentation • Ensure compliance with corporate and governmental requirements. • Generate reports that are easy to document and verify • Produce consistent, reproducible results that are easy to communicate www.qlx.com
Extending Analytics Capabilities • Extend built-in capabilities with custom code and scripts • Add personalized analyses to suit specific business needs • Use advanced SAS programming for unique visualizations and models www.qlx.com
Conclusion • Qualex Consulting Services, Inc. is a top provider of innovative software solutions and services, driving success www.qlx.com
CONTACT US • +1 877-887-4727 info@qlx.com • 1111 Kane Concourse, Suite 320, Bay Harbor Islands, FL 33154, USA • www.qlx.com