Download
1 / 43
430 likes | 647 Views
Pennsylvania Education Finance Symposium November 20, 2008. National Update. Resource Gaps. Education Justice. Molly Hunter, Esq. Education Justice MHunter@edlawcenter.org 60 Park Place, Suite 300 Newark, New Jersey 07102. Education Law Center. Standing Up for Public School Children.

E N D
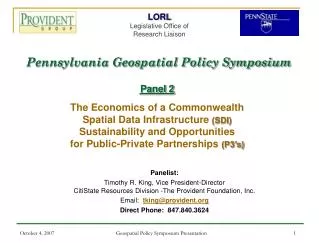
Pennsylvania Education Finance Symposium November 20, 2008
Education Justice Molly Hunter, Esq.Education Justice MHunter@edlawcenter.org 60 Park Place, Suite 300Newark, New Jersey 07102 Education Law Center Standing Up for Public School Children
Corridor of Shame Source: Bud Ferillo, Corridor of Shame
Resource Gaps • Preschool • Buildings • Teaching Quality • Money
Preschool Participation by Poverty Status Age 3 Age 4 Source: NHES 1991 and 2005.
Preschool by Income: 2005 Source: NHES 2005
Preschool Participation by Ethnicity Age 3 Age 4 Source: NHES 1991 and 2005.
Investment Increases with Fewer Low-income Students Enrollment School year 2001-2002 $9, 361 $7, 105 $6, 302 $4,800 $5, 179 School Districts by Percent Eligible for FRL Source: McGraw-Hill Construction; National Center for Education Statistics
Disparity Increases with Household Income Census 2000 Public School Enrollment $11,500 $7,922 $6,045 $4,140 $4,824 Median Household Income by Zip Code Source: McGraw-Hill Construction; U.S. Census Bureau, Census 2000 Summary File 3 (SF3)
Minority Districts Fall Behind Enrollment SY2003-04 (in Thousands) $7,102 $6,452 $5,172 $5,612 School District Types by Race and Ethnicity Source: McGraw-Hill Construction; National Center for Education Statistics
Minority Students Inexperienced Teachers *Teachers with 3 or fewer years of experience. “High” and “low” refer to top and bottom quartiles. Source: National Center for Education Statistics, “Monitoring Quality: An Indicators Report,” December 2000. *Teachers with 3 or fewer years of experience. “High” and “low” refer to top and bottom quartiles. Source: National Center for Education Statistics, “Monitoring Quality: An Indicators Report,” December 2000.
High-Poverty Schools More Low-Scoring Teachers *Teachers scoring in the bottom quartile on SAT/ACT. “High-poverty” schools have 2/3 or more students eligible for reduced-price lunch. Source: Education Week, “Quality Counts 2001,” January 2001.
Source:Reported inAll Talk, No Action: Putting an End to Out-of-Field Teaching, Craig D. Jerald, The Education Trust. 2002
African American Middle Schools Out-of-Field Teachers *Teachers lacking a college major or minor in the field. Source: Richard M. Ingersoll, University of Pennsylvania. Unpublished data from 1999-2000.
Latino High Schools Out-of-Field Teachers *Teachers lacking a college major in the field. Data for high school core academic classes only. Source: Richard M. Ingersoll, University of Pennsylvania. Unpublished data from 1999-2000.
North Carolina PovertyInexperienced Teachers SOURCE: Clotfelter et al 2006
More Urban Teachers Lack experience Not certified Failed certification exam SOURCE: Lankford, Loeb, Wyckoff 2002
Teachers Transferred 27 to 21 class size Salary + $7,306 68% to 21% poor New York City Region SOURCE: Lankford, Loeb, Wyckoff 2002
High-Poverty DistrictsLess Funding ILLINOIS - $2,235 U.S. - $ 938 MINN. $1,629 No Adjustment for Need SOURCE: Ed Trust 2008
High-Minority DistrictsLess Funding U.S. - $ 877 N.J. $ 2,633 No Adjustment for Need SOURCE: Ed Trust 2008
Thank You Molly Hunter, Esq.Education Justice973.624.1815, ext. 19 MHunter@edlawcenter.org 60 Park Place, Suite 300Newark, New Jersey 07102 Education Law Center Standing Up for Public School Children