Download
1 / 14
140 likes | 248 Views
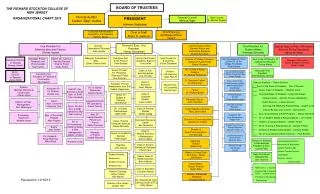
Board of Trustees Quarterly Data Report Volume 1, Number 2. Graduation and Retention Update January 7, 2014. Retention Rates. Retention Rates. Graduation Rates. Relation between Retention and Graduation. Positive Predictors of Institutional Graduation Rates.

E N D
Board of Trustees Quarterly Data Report Volume 1, Number 2 Graduation and Retention Update January 7, 2014
Predictive Modeling for 2005 Cohorts(227 Public and Non-Profit Privates)
Predictive Modeling for 2005 Cohorts(227 Public and Non-Profit Privates) • After accounting for student & institutional factors, our retention and graduation rates are essentially the same as other comprehensive masters institutions. Stated otherwise, we are positioned right where one would expect us to be. • Once we know the factors in the preceding table, factors found to be insignificant include: • Whether school is public or private • City, rural, or suburban locations • Total enrollment • Total undergrads • Total applicants • Total FTE • FTIC percentage • Other SAT or ACT thresholds • Total tuition & fee revenue • Affordability index • Percentage of black students • Percentage of white students • Percentage with any aid • Percentage of FTICs with Pell • Average Pell for FTICs • Total dorm rooms • Remoteness of location
Predictive Modeling of Second-Year Retention(UNF Students Only, 2008-2012 Cohorts)
Predictive Modeling of Second-Year Retention(UNF Students Only, 2008-2012 Cohorts)
Predictive Modeling of Second-Year Retention(UNF Students Only, 2008-2012 Cohorts) • A student’s grades are the key driver of retention and graduation. • Living on campus is highly related to retention at all three points in time. Moreover, the size of the effect of on-campus housing on retention was the same whether on-campus was mandatory or optional. • Upon a student’s arrival at UNF, high school GPA and AP credits are good predictors of retention, whereas SAT scores are not. • Once the FTIC gets through his/her first fall, even the high school GPA is no longer a good predictor. After the first spring, AP credits also drop out as good predictors. • Fall term GPA is a strong predictor once student gets through his/her first Fall term. Spring term GPA and spring hours earned are strong predictors once student gets through his/her first Spring term.
Predictive Modeling of Second-Year Retention(UNF Students Only, 2008-2012 Cohorts) • There is evidence we retain Black, Asian-Pacific Islander, and Asian students more readily than White students. • There is no gender effect. • There is no effect of the college being targeted as they come in our door (all comparisons are versus COAS), but CCEC majors show higher retention once they’re through the spring term. • Out-of-state students, and students from all regions except regions 6 and 7, are retained at a lower rate than region 2 (our home region). • Once through the spring term, 2012 FTICs do show higher retention than FTICs from all earlier years, but there’s not conclusive evidence that 2012 was indeed better (i.e., the differences observed could be random).