Download
1 / 2
20 likes | 94 Views
Low energy particles. High energy particles. Screen. Synch light fan generated by the bending magnets. The energy spread of the bunch may be measured by monitoring the synchrotron light generated by the beam in the dispersion of the A-line bend.

E N D
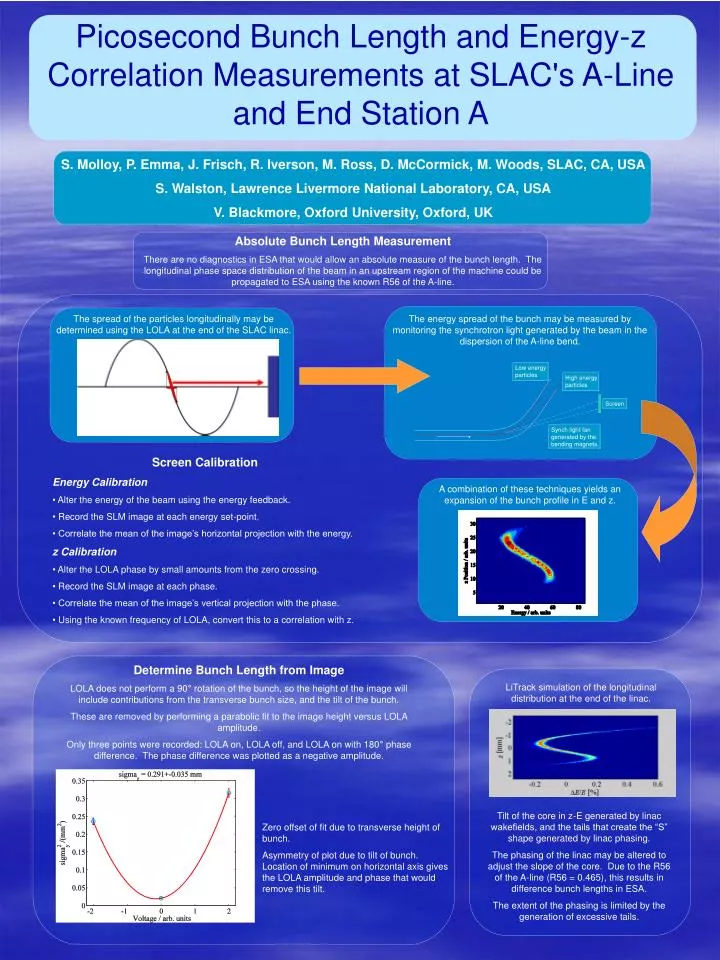
Low energy particles High energy particles Screen Synch light fan generated by the bending magnets. The energy spread of the bunch may be measured by monitoring the synchrotron light generated by the beam in the dispersion of the A-line bend. LiTrack simulation of the longitudinal distribution at the end of the linac. Tilt of the core in z-E generated by linac wakefields, and the tails that create the “S” shape generated by linac phasing. The phasing of the linac may be altered to adjust the slope of the core. Due to the R56 of the A-line (R56 = 0.465), this results in difference bunch lengths in ESA. The extent of the phasing is limited by the generation of excessive tails. Picosecond Bunch Length and Energy-z Correlation Measurements at SLAC's A-Line and End Station A S. Molloy, P. Emma, J. Frisch, R. Iverson, M. Ross, D. McCormick, M. Woods, SLAC, CA, USA S. Walston, Lawrence Livermore National Laboratory, CA, USA V. Blackmore, Oxford University, Oxford, UK Absolute Bunch Length Measurement There are no diagnostics in ESA that would allow an absolute measure of the bunch length. The longitudinal phase space distribution of the beam in an upstream region of the machine could be propagated to ESA using the known R56 of the A-line. The spread of the particles longitudinally may be determined using the LOLA at the end of the SLAC linac. • Screen Calibration • Energy Calibration • Alter the energy of the beam using the energy feedback. • Record the SLM image at each energy set-point. • Correlate the mean of the image’s horizontal projection with the energy. • z Calibration • Alter the LOLA phase by small amounts from the zero crossing. • Record the SLM image at each phase. • Correlate the mean of the image’s vertical projection with the phase. • Using the known frequency of LOLA, convert this to a correlation with z. A combination of these techniques yields an expansion of the bunch profile in E and z. Determine Bunch Length from Image LOLA does not perform a 90° rotation of the bunch, so the height of the image will include contributions from the transverse bunch size, and the tilt of the bunch. These are removed by performing a parabolic fit to the image height versus LOLA amplitude. Only three points were recorded: LOLA on, LOLA off, and LOLA on with 180° phase difference. The phase difference was plotted as a negative amplitude. Zero offset of fit due to transverse height of bunch. Asymmetry of plot due to tilt of bunch. Location of minimum on horizontal axis gives the LOLA amplitude and phase that would remove this tilt.
Relative Bunch Length Measurements A system that measures the relative bunch length for every pulse could be employed as part of a feedback system. This system is based on the bunch length measurements of the SLC final focus system at SLAC. Since the power radiated at a certain frequency P(ω) is proportional to the square of the charge, it must be normalised by this value. Abstract We report on measurements of picosecond bunch lengths and the energy-z correlation of the bunch with a high energy electron test beam to the A-line and End Station A (ESA) facilities at SLAC. The bunch length and the energy-z correlation of the bunch are measured at the end of the linac using a synchrotron light monitor diagnostic at a high dispersion point in the A-line and a transverse RF deflecting cavity at the end of the linac. Measurements of the bunch length in ESA were made using high frequency diodes (up to 100 GHz) and pyroelectric detectors at a ceramic gap in the beamline. Modeling of the beam's longitudinal phase space through the linac and A-line to ESA is done using the 2-dimensional tracking program LiTrack, and LiTrack simulation results are compared with data. High frequency diode and pyroelectric detectors are planned to be used as part of a bunch length feedback system for the LCLS FEL at SLAC. The LCLS also plans precise bunch length and energy-z correlation measurements using transverse RF deflecting cavities. The measured longitudinal distribution is converted into an array of several thousand points that represent the bunch in E-z space. Using a dedicated longitudinal dynamics software package (such as LiTrack), this distribution is tracked around the A-line into ESA. Since there are no accelerating elements in the A-line, a simple R-matrix calculation suffices (as shown). The length of the bunch at LOLA and in ESA was measured for a series of linac phase settings. Experimental Setup Four different diodes were tested. ~20 m of WR90 brought a portion of the radiation from a ceramic gap (see photo) to a splitter, which then directed the power to two identical, ~20 GHz diodes, via 16 and 23 GHz lowpass filters. ~1 m of WR10 (see photo) was used to channel the power to two 100 GHz diodes. Principle of Measurement A beam radiates RF as it passes the electrical discontinuity presented by a ceramic gap. The spectrum of this radiation is determined by the bunch shape. Thus, shorter bunches will generate higher frequency RF, and a measurement of the power present in a particular frequency band will provide a relative measure of the bunch length. This experiment used diodes sensitive to different frequency bands, and a pyro detector to monitor radiation produced at ceramic gaps in the ESA beamline. Both the 100 GHz and the pyro-detector respond strongly to changing the linac phase ramp, indicating a strong response to the bunch length. The pyro is capable of measuring shorter lengths due to its wideband response. When plotted alongside the bunch length as measured by LOLA, it can be seen that the 100 GHz diode has a dynamic range of at least 400 – 800 µm. This is consistent with the theory.