Download
1 / 23
230 likes | 314 Views
This paper introduces a spectral clustering approach to combine numerical vectors with a modular network for heterogeneous data clustering. It covers motivation for clustering heterogeneous data, the proposed method using spectral clustering, and experiments with synthetic and real data. The cost of combining numerical vectors with a network, complex network properties, normalized network modularity, and cost optimization are discussed. Results for synthetic data with numerical vectors and network are presented along with the application of the approach to gene networks. The proposed method is summarized emphasizing global network properties and optimization possibilities for improved clustering performance.

E N D
A Spectral Clustering Approach to Optimally Combining Numerical Vectors with a Modular Network Motoki Shiga, Ichigaku Takigawa, Hiroshi Mamitsuka Bioinformatics Center, ICR, Kyoto University, Japan KDD 2007, San Jose, California, USA, August 12-15 2007 1
Table of Contents • MotivationClustering for heterogeneous data(numerical + network) • Proposed method Spectral clustering (numerical vectors + a network) • ExperimentsSynthetic data and real data • Summary 2
Heterogeneous Data Clustering Heterogeneous data : various information related to an interest Ex.Gene analysis: gene expression, metabolic pathway, …, etc. Web page analysis : word frequency, hyperlink, …, etc. Numerical Vectors k-means SOM, etc. Gene expression #experiments = S S-th value Gene 1 … 3 To improve clustering accuracy, combine numerical vectors + network 2 1st expression value metabolicpathway 5 4 Network Minimum edge cut Ratio cut, etc. 7 6 3 M. Shiga, I. Takigawa and H. Mamitsuka, ISMB/ECCB2007.
Related work : semi-supervised clustering ・Local property Neighborhood relation -must-link edge, cannot-link edge ・Hard constraint (K. Wagstaff and C. Cardie, 2000.)・Soft constraint(S. Basu etc., 2004.) - Probabilistic model (Hidden Markov random field) Proposed method ・Global property(network modularity) ・Soft constraint -Spectral clustering 4
Table of Contents • MotivationClustering for heterogeneous data(numerical + network) • Proposed method Spectral clustering (numerical vectors + a network) • ExperimentsSynthetic data and real data • Summary 5
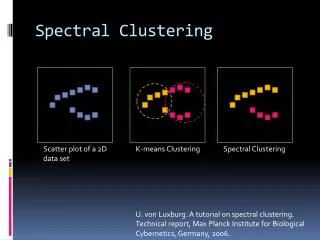
Spectral Clustering L. Hagen, etc., IEEE TCAD, 1992., J. Shi and J. Malik, IEEE PAMI, 2000. 1. Compute affinity(dissimilarity) matrix M from data 2. To optimize cost J(Z) = tr{ZTMZ} subject to ZTZ=I where Z(i,k) is 1 when node i belong to cluster k, otherwise 0, Trace optimization compute eigen-values and -vectors of matrix M by relaxing Z(i,k) to a real value e2 Each node is by one or more computed eigenvectors Eigen-vector e1 3. Assign a cluster label to each node ( by k-means ) 6
Cost combining numerical vectors with a network network Cost of numerical vector cosine dissimilarity What cost? N : #nodes, Y : inner product of normalized numerical vectors To define a cost of a network, use a property of complex networks 7
Complex Networks Ex. Gene networks, WWW, Social networks, …, etc. • Property • Small world phenomena • Power law • Hierarchical structure • Network modularity Ravasz, et al., Science, 2002. Guimera, et al., Nature, 2005. 8
Normalized Network Modularity = density of intra-cluster edges High Low # intra-edges # total edges normalize by cluster size Z : set of whole nodes Zk : set of nodes in cluster k L(A,B) : #edges between A and B Guimera, et al., Nature, 2005., Newman, et al., Phy. Rev. E, 2004. 9
Cost Combining Numerical Vectors with a Network network Cost of numerical vector Normalized modularity (Negative) cosine dissimilarity Mω 10
Our Proposed Spectral Clustering for ω = 0…1 Compute matrix Mω= To optimize cost J(Z) = tr{ZTMωZ} subjet to ZTZ=I,compute eigen-values and -vectors of matrix Mωbyrelaxing elements of Z to a real valueEach node is represented by K-1eigen-vectors Assign a cluster label to each node by k-means.(k-means outputs in spectral space.) e2 e2 e1 is sum of dissimilarity (cluster center <-> data) end ・Optimizeweight ω x x Eigen-vector e1 11
Table of Contents • MotivationClustering for heterogeneous data(numerical + network) • Proposed method Spectral clustering (numerical vectors + a network) • ExperimentsSynthetic data and real data • Summary 12
Synthetic Data Numerical vectors (von Mises-Fisher distribution) θ = 1 50 5 x3 x3 x3 x2 x2 x2 x1 x1 x1 Network (Random graph) #nodes = 400, #edges = 1600 Modularity = 0.375 0.450 0.525 13
Results for Synthetic Data Modularity = 0.375 Numerical vectors 5 50 θ = 1 θ = 1 x3 x3 x3 Costspectral θ = 5 θ = 50 x2 x2 x2 x1 x1 x1 Network NMI #nodes = 400, #edges = 1600 Modularity = 0.375 ω Network only (maximum modularity) Numerical vectors only (k-means) ・Best NMI (Normalized Mutual Information) is in 0 < ω < 1・Can be optimized using Costspectral 14
Results for Synthetic Data Modularity = 0.375 0.450 0.525 θ = 1 Costspectral θ = 5 θ = 50 NMI ω ω ω Network only (maximum modularity) Numerical vectors only (k-means) ・Best NMI (Normalized Mutual Information) is in 0 < ω < 1・Can be optimized using Costspectral 15
Synthetic Data (Numerical Vector) + Real Data (Gene Network) True cluster (#clusters = 10) Resultant cluster (ω=0.5, θ=10) θ = 10 Costspectral θ = 102 θ = 103 Gene network by KEGG metabolic pathway NMI ・Best NMI is in 0 < ω < 1 ・Can be optimized using Costspectral ω 16
Summary • New spectral clustering method proposedcombining numerical vectors with a network・Global network property(normalized network modularity)・Clustering can be optimized by the weight • Performance confirmed experimentally・Better than numerical vectors only and a network only・Optimizing the weight with synthetic dataset and semi-real dataset 17
Thank you for your attention! our poster #16
Spectral Representation of Mω (concentration θ = 5 , Modularity = 0.375) ω = 0.3 ω = 0 ω = 1 e3 e3 e3 e2 e2 e2 e1 e1 e1 Cost Jω = 0.0932 0.0538 0.0809 Select ω by minimizing Costspectral (clusters are divided most separately)
Result for Real Genomic Data • Numerical vectors : Hughes’ expression data (Hughes, et al., cell, 2000) • Gene network : Constructed using KEGG metabolic pathways(M. Kanehisa, etc. NAR, 2006) Our method Normalized cut Ratio cut NMI Costspectral Our method ω ω
Evaluation Measure Normalized Mutual Information (NMI) between estimated cluster and the standard cluster H(C) : Entropy of probability variable C, C : Estimated clusters, G : Standard clusters The more similar clusters CandG are, the larger the NMI. 14
Web Page Clustering Numerical Vector Frequency of word Z … Frequency of word A To improve accuracy, combine heterogynous data 1 2 3 Network 4 5 6 7
Spectral Clustering for Graph Partitioning Ratio cut Subject to Normalized cut Subject to L. Hagen, etc., IEEE TCAD, 1992., J. Shi and J. Malik, IEEE PAMI, 2000.