Download
1 / 44
440 likes | 619 Views
Using synchrotron transmission FTIR microspectroscopy for microstructure-chemical. 甲硫胺酸 (methionine, Met). 脊椎動物的必需氨基酸之ㄧ 魚類營養需求 缺乏時, 1. 成長低落 2. 白內障 3. 體組成改變. Diet formulation for juvenile grouper ( Epinephelus coioides ). Protein sources: fish meal and soybean protein

E N D
Using synchrotron transmission FTIR microspectroscopy for microstructure-chemical
甲硫胺酸(methionine, Met) • 脊椎動物的必需氨基酸之ㄧ • 魚類營養需求 • 缺乏時, 1.成長低落 2.白內障 3.體組成改變
Diet formulation for juvenile grouper(Epinephelus coioides) Protein sources: fish meal and soybean protein Met source: crystal methionine (Luo et al., 2005)
Cap-methionine • Non-crystal • Methionine coat by cellulose acetate phthalate (Cap), film-like • Delay the excluded time of cap-methionine in digest duct
In our previous study, cap-methionine more easily absorbed than crystal-met in shrimp nutrition. (Chen et al., 2000) • We want to know the effect of dietary cap-methionine and optimal level on grouper and .
Diet formulation for juvenile grouper(Epinephelus malaba) Protein sources: fish meal, soybean protein and gelatin Met source: cap-methionine
Each dietary treatment has 3-4 replicate tanks, each holding 8-12 test fish. • At the end of the 2 month trial, weight increment will be measured. • The tissue will be check by synchrotron transmission FTIR microspectroscopy for microstructure.
選用同步紅外顯微技術 • 靈敏度高,空間解析度高 • 可與ㄧ般傳統化學分析比較 • 減少樣品損失與失真 • 魚體組織的官能基確認和微結構分析
傳統的紅外顯微術 • Infrared microspectroscopy, IMS • 係使用黑體輻射光源,其聚焦光束的大小受光學繞射極限(diffraction limitation) 的限制 • 只有數十微米尺度的空間解析(spatial resolution)
Sample preparation • 冷凍切片 • 樣品放在紅外專用載玻片(low-e slide) 上 • 以去離子水去除包埋物質 • 待測
紅外光束線的能量範圍在大約 1.23 eV ~ 0.05 eV (10000 ~ 400 wavenumbers ) 波長範圍在1.0 um -25 um 光譜的解析度是 0.125 wavenumber 由干涉儀中移動鏡移動時所造成的光程差所決定。 紅外顯微光束線 BL14A
係利用同步輻射加速器偏轉磁鐵光源建立的紅外係利用同步輻射加速器偏轉磁鐵光源建立的紅外 提供可達中紅外光區繞射極限8-10 um 之空間解析的光譜影像分析 紅外顯微術實驗站
BL14A傅立葉轉換紅外光譜影像系統 • Thermo Nicolet, Magna-IR 860 and Continuum • 專為中紅外光區設計 • 此紅外光束線是由一偏轉磁鐵 (bending magnet, 強度1.23 tesla) 引出
BL14A傅立葉轉換紅外光譜影像系統 • 主要是麥克森干涉儀(Michelson interferometer)及紅外顯微鏡(infrared • microscopy),並配合電腦系統執行傅立葉轉換及數據處理。
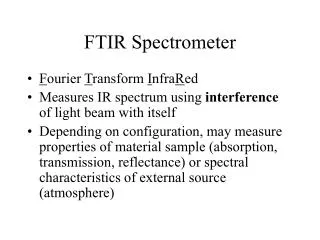
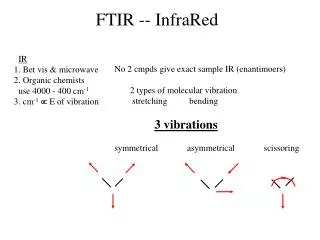
Monochromator type, FTIR Fourier transform infrared spectroscopy
(a)Michelson(麥克森) 干涉儀示意圖 (b)光強度與移動鏡位置之關係之干涉圖譜 • 分光片以KBr為主要材質,表面鍍一層Ge/Sb2S3 • 偵測器為汞鎘碲(mercury-cadmium-telluride, MCT)
中紅外吸收光譜技術 • 可獲得物質分子的幾何結構、鍵結種類與化學反應性,並可應用在物質成分的定性或定量分析 • 光譜影像或稱為化學影像(chemical image, CM),由於每個化學成分都有其特徵光譜,藉由這些特徵吸收或放光信號的強弱即可定量或定性物質分子,同時量測分布於樣品上不同區域的物質分子的特徵光譜。
預期結果 • 藉由同步紅外顯微技術分析,得知餵食不同濃度甲硫胺酸飼料後,魚體的背肉,腹肉與肝臟等組織變化,判斷甲硫胺酸的效應
Visible image Spectrum Chemical image 3D image Chemical intensity ruler Yu et al., 2005
參考文獻 • 李耀昌,陳慶曰。同步輻射紅外光譜影像技術應用與發展。國家同步輻射研究中心簡訊 57期8至11頁,2005年。 • 李耀昌,陳慶曰。高解析傅立葉轉換紅外光譜顯微術之原理與應用。科儀新知27卷3期,2005年
參考文獻 • Zhi Luoa, Yong-jian Liua, Kang-sen Maib, Li-xia Tiana and Hui-jun Yang, Dietary l-methionine requirement of juvenile grouper Epinephelus coioides at a constant dietary cystine level, Aquaculture 249 : 409– 418, 2005
FT 就是 Fourier transform (傅立葉轉換),FTIR也是Fourier transform infrared spectroscopy 紅 外專用載玻片(low-e slide)
利用中紅外吸收光譜技術可獲得物質分子的幾何結利用中紅外吸收光譜技術可獲得物質分子的幾何結 構、鍵結種類與化學反應性,並可應用在物質成分 的定性或定量分析。且由於大部分物質分子之振動 基礎躍遷(vibrational fundamental transition) 譜線落 於中紅外光區,所以中紅外光吸收光譜提供了物質 分子獨特的指紋(fingerprint),因此可藉由特徵光
何謂光譜影像?或是稱為化學影像(chemical • image, CM),由於每個化學成分都有其特徵光譜, • 藉由這些特徵吸收或放光信號的強弱即可定量或定 • 性物質分子,同時量測分布於樣品上不同區域的物 • 質分子的特徵光譜。化學影像和一般的光學影像如 • 白光影像及雷射影像不同,一般光學影像為物理影 • 像,與待測物之幾何形狀、顏色及偏光有關,因此 • 一般的光學影像無法分辨不同物質的成分。
但由於 • 不同物質具有不同的吸收或放射之特徵光譜,藉由 • 其特徵光譜來鑑別不同物質之化學成分及其結構, • 因此結合光譜學和影像空間解析所產生的影像稱之 • 為光譜影像,而應用在紅外光區作為鑑別化學物種 • 成分分析之影像則稱為紅外光譜影像。 • 如何擷取光譜影像?傳統方法即結合光源、
紅外顯微術光束線BL14A 其傅立葉轉換紅外 • 光譜影像系統(Thermo Nicolet, Magna-IR 860 and • Continuum) 是專為中紅外光區量身訂作的紅外顯 • 微術實驗站。此紅外光束線是由一偏轉磁鐵 • (bending magnet, 強度1.23 tesla) 引出
Transmission FTIR Microspectroscopic Window Preparation • Fish meal and soybean meal samples were frozen at -20 °C on objective disks with paraffin • Sample size about 20 μm thickness • Paraffin was removed using xylene • Sample were rapidly transferred to BaF2 windows (size=13x1mm disk) for use in synchrotron transmission FTIR microspectroscopic work.
Synchrotron Light Source and Transmission FTIR microspectroscopy Synchrotron Light Source and Transmission FTIR microspectroscopy. The bench was configured with a synchrotron light beamline with an energy level of 800 MeV. The spectra were collected in the mid-infrared range of 4000-800 cm-1 at a resolution of 4 cm-1 with 64 scans co-added and an aperture setting of ca. 10 10 ím. A background spectroscopic image file was collected from an area free of sample. The mapping steps were equal to aperture size. Scanned visible images were obtained using a charge-coupled device (CCD) camera linked to the infrared images.
Photomicrograph of Cross Sections of Plant Tissue • Photomicrographs • (10 10 and 10 40 magnification) of cross sections of the • barley tissue (thickness ) 6 ím) were taken by an Olympus • microscope (Olympus BH-2) with digital camera from regular glass • slides.
Data Analysis and Chemical Imaging. The spectral data of the barley tissues were collected, corrected with the background spectrum, displayed in the absorbance mode, and analyzed using OMNIC software 6.0 (Spectra Tech). The data can be displayed either as a series of spectroscopic images collected at individual wavelengths or as a collection of infrared spectra obtained at each pixel position in the image. Chemical imaging of functional groups was determined by the OMNIC software 6.0 (Spectra Tech): protein indicated by amide I or II, lipid indicated by carbonyl CdO ester linkage band, total carbohydrates, lignin, hemicellusoic and cellulosic materials were determined by the OMNIC software 6.0 (Spectra Tech) (2, 6, 13). Peak height or area ratio images were obtained by the height or area under one functional group band (such as amide I, 1650 cm-1) divided by the height or area under another functional group band (such as starch, 1025 cm-1) at each pixel (pixel size 10 10 ím), which represents the biological component ratio intensity and distribution in the tissue (e.g., protein to total starch ratio image and hemicellulose to total carbohydrate ratio image). RESULTS AND DISCUSSION Photomicrograph of Grain Barley Tissue. The inherent
係利用同步輻射加速器偏轉磁鐵光源建立的紅外係利用同步輻射加速器偏轉磁鐵光源建立的紅外 提供可達中紅外光區繞射極限8-10 um 之空間解析的光譜影像分析 中紅外光4000~400 亦即2.5-25 um, 紅外顯微術實驗站