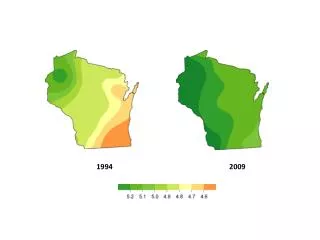
1994
1994. 1995. 1996. 1997. 1998. 1999. 2000. 2001. 2002. 2003. 2004. 2005. 2006. 2007. 2008. 2009. 2010. Major changes to the survey method in 2011 more detail at http://www.cdc.gov/surveillancepractice/reports/brfss/brfss.html. 2011. 2012. 2013. 2014. 2015. 1994. 2000.


1994
E N D
Presentation Transcript
Major changes to the survey method in 2011 more detail at http://www.cdc.gov/surveillancepractice/reports/brfss/brfss.html
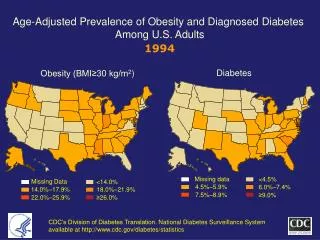
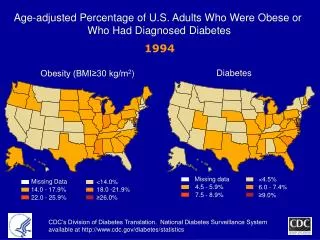
1994 2000 1994 2000 No Data <4.5% 4.5%–5.9% 6.0%–7.4% 7.5%–8.9% >9.0% No Data <14.0% 14.0%–17.9% 18.0%–21.9% 22.0%–25.9% > 26.0% Age-adjusted Prevalence of Obesity and Diagnosed Diabetes Among US Adults Obesity (BMI ≥30 kg/m2) 2015 Diabetes 2015 CDC’s Division of Diabetes Translation. United States Surveillance System available at http://www.cdc.gov/diabetes/data