Download
1 / 64
640 likes | 786 Views
Neural Nets and Genetic Algo rithm s in Data Mining. Muhammad Ali Yousuf. References. Based on Lectures by M. Zaki http://www.cs.rpi.edu/~zaki/dmcourse/ and David Squire http://www.c sse.monash.edu.au. Lecture Outline. Why study neural networks?

E N D
Neural Nets and Genetic Algorithms in Data Mining Muhammad Ali Yousuf
References • Based on Lectures by M. Zaki • http://www.cs.rpi.edu/~zaki/dmcourse/ • and • DavidSquire • http://www.csse.monash.edu.au
Lecture Outline • Why study neural networks? • What are neural networks and how do they work? • History of artificial neural networks (NNs) • Applications and advantages • Choosing and preparing data • An illustrative example
Why Study Neural Networks? - 1 • Two basic motivations for NN research: • to model brain function • to solve engineering (and business) problems
Why Study Neural Networks? - 1 • So far as modeling the brain goes, it is worth remembering:“… metaphors for the brain are usually based on the most complex device currently available: in the seventeenth century the brain was compared to a hydraulic system, and in the early twentieth century to a telephone switchboard. Now, of course, we compare the brain to a digital computer.”
Why Study Neural Networks? - 2 • Historically, NN theories were first developed by neurophysiologists. • For engineers (and others), the attractions of NN processing include: • inherent parallelism • speed (avoiding the von Neumann bottleneck) • distributed “holographic” storage of information • robustness • generalization • learning by example rather than having to understand the underlying problem (a double-edged sword!)
Why Study Neural Networks? - 3 • It is important to be wary of the black-box characterization of NNs as “artificial brains”
Why Study Neural Networks? - 3 • Beware of the anthropomorphisms common in the field (let alone in popular coverage of NNs!) • learning • memory • training • forgetting • Remember that every NN is a mathematical model. There is usually a good statistical explanation of NN behaviour
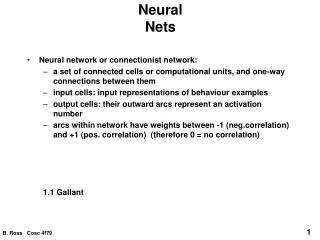
What Is a Neuron? - 1 • a (biological) neuron is a node that has many inputs and one output • inputs come from other neurons or sensory organs • the inputs are weighted
What Is a Neuron? - 1 • weights can be both positive and negative • inputs are summed at the node to produce an activation value • if the activation is greater than some threshold, the neuron fires
What Is a Neuron? - 2 • In order to simulate neurons on a computer, we need a mathematical model of this node • node i has ninputsxj • each connection has an associated weightwij • the net input to node i is the sum of the products of the connection inputs and their weights:
What Is a Neuron? - 2 • The output of node i is determined by applying a non-linear transfer functionfi to the net input:
What Is a Neuron? - 3 • A common choice for the transfer function is the sigmoid:
What Is a Neuron? - 3 • The sigmoid has similar non-linear properties to the transfer function of real neurons: • bounded below by 0 • saturates when input becomes large • bounded above by 1
What is a neural network? • Now that we have a model for an artificial neuron, we can imagine connecting many of them together to form an Artificial Neural Network: Output layer Hidden layer Input layer
Applications of NNs • Predicting financial time series • Diagnosing medical conditions • Identifying clusters in customer databases • Identifying fraudulent credit card transactions • Hand-written character recognition (cheques) • Predicting the failure rate of machinery • and many more….
Using a Neural Network for Prediction - 1 • Identify input and outputs • Preprocess inputs - often scale to the range [0,1] • Choose a NN architecture (see next slide) • Train the NN with a representative set of training examples (usually using BP) • Test the NN with another set of known examples • often the known data set is divided in to training and test sets. Cross-validation is a more rigorous validation procedure. • Apply the model to unknown input data
Using a Neural Network for Prediction - 2 • The network designer must decide the network architecture for a given application • It has been proven that one hidden layer is sufficient to handle all situations of practical interest
Using a Neural Network for Prediction - 2 • The number of nodes in the hidden layer will determine the complexity of the NN model (and thus its capacity to recognize patterns) • BUT, too many hidden nodes will result in the memorization of individual training patterns, rather than generalization • Amount of available training data is an important factor - must be large for a complex model
Neural network An example Living space Size of garage Age of house Heating type Other attributes • Note that here the network is treated as a “black-box” Appraised value
Issues in choosing the training data set • The neural network is only as good as the data set with which it is trained upon • When selecting training data, the designer should consider: • Whether all important features are covered • What are the important/necessary features • The number of inputs • The number of outputs • Availability of hardware
Preparing Data • Preprocessing is usually the most complicated and time-consuming issue when working with NNs (as with any DM tool)
Preparing Data • Main types of data encountered: • Continuous data with known min/max values (range/domain known). There problems with skewed distributions: solutions include removing values or using log function to filter • Ordered, discrete values: e.g. low, medium, high • Categorical values (no order): e.g. {“Male”, “Female”, “Unknown”} ( use “1 of N coding” or “1 of N-1 coding”)
Preparing Data • There will always be other problems where the analyst’s experience and ingenuity must be used
Illustrative Example – 1(Following http://www.geog.leeds.ac.uk/courses/level3/geog3110/week6/sld047.htm Ff.) • Organization • a building society with 5 million customers and using a direct mailing campaign to promote a new investment product to existing savers
Illustrative Example – 1(Following http://www.geog.leeds.ac.uk/courses/level3/geog3110/week6/sld047.htm Ff.) • Available data • The 5 million customer database • Results of an initial test mailing where 50,000 customers (randomly selected) were mailed. There were 1000 responses (2%) in terms of product take up • Objective • Find a way of targeting the mailing so that: • the response rate is doubled to 4% • at least 40,000 new investment holders are brought in
Illustrative Example - 2 • For simplicity we assume that only two attributes (features) of a customer are relevant for this situation: • TIMEAC: time (in years) that the account has been open • AVEBAL: average account balance over the past 3 months
Illustrative Example - 2 • Examining the data, it was obvious to analysts that the pattern of respondents is different from the non-respondents. But what are the reasons for this? • We need to know the reasons to select/develop a model for identifying such responding customers
Neural network Illustrative Example - 3 • A neural network can be used to model this data without having to make any assumptions for the reasons of such patterns • Let a neural network learn the pattern from the data and classify the data for us AVEBAL SCORE TIMEAC
Illustrative Example - 4Preparing the training and test data sets • We have 1000 respondents. Randomly split in to a training set and a test set: 500 respondents+ 500 non-respondents 1000 (training test) 500 respondents+ 500 non-respondents 1000 (test test)
Illustrative Example - 4: Preparing the training and test data sets • The network is trained by making repeated passes over the training data, adjusting weights using the BP algorithm
Illustrative Example - 5Using the resultant network • Order the score value for the test in descending order (see next slide) • 45 degree line shows the results if random ranking is used (since the test set consists of 50% “good” customers) • The extent to which the graph deviates from the 45 degree line shows the power of the model to discriminate between good and bad customers • Now calculate the number of customers required to be mailed to achieve the company objective
Illustrative Example - 7 • Analysis shows that company objectives are achievable: 40,000 product holders at 4% response • Can save hundreds of thousands of dollars in mailing costs • Better than the other model in this example
Unsupervised Learning - Motivation - 1 • The feed-forward back-propagation NNs discussed last week are an example of a supervised learning technique • In supervised learning, the aim is to discover a relationship between the inputs and outputs of a system
Unsupervised Learning - Motivation - 1 • This relationship can be used for tasks such as prediction, estimation or classification • A known training set of input/output pairs is used to train the network
Motivation - Unsupervised Learning • Many data mining tasks are not suited to this approach • Often the data mining task is to discover structure in the data set, without any prior knowledge of what is there
Motivation - Unsupervised Learning • This is an example of unsupervised learning (we have already seen the example of the K-means clustering algorithm) • A class of neural networks called Self-Organizing Maps (SOMs) can be used for this task
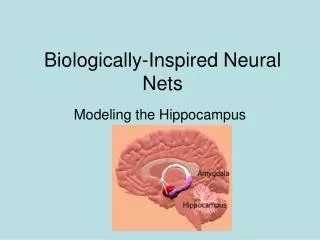
The Cortex - 1 • SOMs research was inspired by the observation of topologically correct sensory maps in the cortex • In humans, the cortex consists of a layer of nerve tissue about 0.2m2 in area and 2-3mm in thickness • It is highly convoluted to save space, and forms the exterior of the brain - it’s the folded, wrinkled stuff we see when we look at a brain
The Cortex - 2 Lateral (schematic) view of the human left-brain hemisphere. Various cortical areas devoted to specialized tasks can be distinguished [RMS1992, p. 18]
Sensory Surfaces • Most signals that the brain receives from the environment come from “sensory surfaces” covered with receptors: • skin (touch and temperature) • retina (vision) • cochlea [in the ear] (1-D sound sensor) • It is usually found that the “wiring” of the nervous system exhibits topographic ordering: • signals from adjacent receptors tend to be conducted to adjacent neurons in the cortex
Kohonen’s Self-Organizing Network - 1 • Kohonen [Koh1982] studied a system consisting of a two-dimensional layer of neurons, with the properties: • each neuron identified by its position vector r (i.e. its coordinates) • input signals to the layer represented by a feature vector x (usually normalized) • output of each neuron is a sigmoidal function of its total activation (as for MLPs ):
Kohonen’s Self-Organizing Network - 2 • Each neuron r forms the weighted sum of the input signals. The external activation is:(the magnitudes of the weight vectors are usually normalized) • In addition to the input connections, the neurons in the layer are connected to each other • the layer has internal feedback
Kohonen’s Self-Organizing Network - 2 • The weight from neuron r’ to neuron r is labelled grr’ • These lateral inputs are superimposed on the external input signal:
Kohonen’s Self-Organizing Network - 3 • The output of neuron r is thus given by: • The neuron activities are the solutions of this system of non-linear equations
Kohonen’s Self-Organizing Network - 3 The feedback due to the lateral connections grr’ is usually arranged so that it is excitatory at small distances and inhibitory at large distances. This is often called a “Mexican Hat” response
Kohonen’s Self-Organizing Network - 4 • The solution of such systems of non-linear equations is tedious and time-consuming. Kohonen avoided this by introducing a simplification. Kohonen’s model showing excitation zone around “winning” neuron [RMS p. 64]
Kohonen’s Self-Organizing Network - 5 • The response of the network is assumed to always be the same “shape”: • the response is 1 at the location of the neuron r* receiving maximal external excitation, and decreases to 0 as one moves away from r* • The excitation of neuron r is thus only a function of its distance from r*:
Kohonen’s Self-Organizing Network - 5 • The model then proposes a rule for changing the weights to each neuron so that a topologically ordered map is formed. Weight change is:
Kohonen’s Self-Organizing Network - 6 • Experiments have shown that the precise shape of the response is not critical • A suitable function is thus simply chosen. The Gaussian is a suitable choice: