Download
1 / 15
150 likes | 239 Views
Explore the spatial patterns of poverty and human well-being in Kenya through an atlas showcasing nature's benefits. Analyze dimensions of well-being across administrative units, provinces, and districts between 1989-1999.

E N D
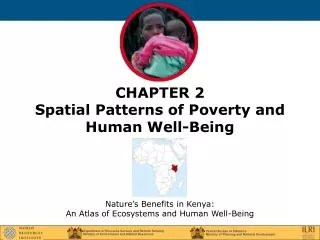
CHAPTER 2Spatial Patterns of Poverty and Human Well-Being Nature’s Benefits in Kenya:An Atlas of Ecosystems and Human Well-Being
Nyanza Province: Poverty Rate At District Level, 1999 At Location Level, 1999
Human Population Density 1989 1999
Poverty Rate: Percentage of Population Below the Poverty Line, 1999
Poverty Density: Number of Poor People Per Square Kilometer, 1999
Minimum Amount of Kenyan Shillings Needed Per SquareKilometer Per Month to Close the Poverty Gap, 1999