Overview of AIMSweb Reports
230 likes | 937 Views
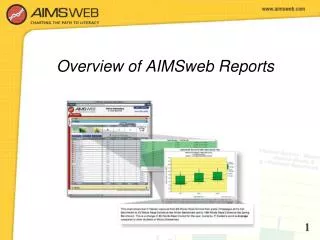
Overview of AIMSweb Reports. 1. Viewing Reports. From the Reports tab, you can view different Benchmark reports. Select the Class tab on the left side to view individual student reports and classroom reports. 2. Viewing Individual Student Reports.

Overview of AIMSweb Reports
E N D
Presentation Transcript
Viewing Reports From the Reports tab, you can view different Benchmark reports. Select the Class tab on the left side to view individual student reports and classroom reports. 2
Viewing Individual Student Reports Click a student’s score to view the Student Benchmark Scores Report. Click the GOM column heading to generate a Benchmark Scores Report for the entire classroom. 3
Viewing Individual Student Reports Student Pathway Reports are available. The Pathway Report displays a student’s scores for all GOMS. Click the Report link under the column to view these reports. 4
The green box plot and whiskers can represent scores from your school, from WOVSED, or from the AIMSweb aggregate. The blue dot represents the student’s score. The thick black target line represents the AIMSweb aggregate’s 50th percentile. 5
Viewing Classroom Reports – Entire Class You can also access seven classroom level reports, available for each GOM. Click the icons to view each report. 6
Score & Percentile TableRanks students from highest to lowest based on their score on a single measure.Colors are based on comparison to AIMSweb aggregate norms. Target = 50th %ile of AIMSweb aggregate<10th %ile = red11th – 24th %ile = yellow>25th %ile = green 7
Click the expand link at the top of the report to insert the AIMSweb aggregate target. Click show target, and display
Shows scores for individual measures and averages them to make an overall instructional recommendation. Instructional Recommendations 9
Summary of Impact of Instructional Program Students are sorted according to percentile as compared to the AIMSweb aggregate norm.
Classroom Histogram This report can be used to compare a classroom performance to the RtI triangle.
Improvement Report Shows rate of improvement across the year for General Ed, Title 1, and Special Ed. * Not all schools provided this identifying information when entering students into AIMSweb.
Comparison Report The classroom performance can be compared to WOVSED using AIMSweb aggregate norms.
Achievement Percents This report can be used to compare grade-level performance to the RtI triangle.
Below/Above Target This report shows the percentage of students who met the target. The target is set at the 50th %ile of AIMSweb aggregate.
Norm Chart Shows school or district performance at each benchmark
Viewing Targets From the Reports tab you can view the Aggregate Norm Table. Be sure to select the appropriate measure. 18
Viewing Targets Targets are based on the 50th percentile. The Growth Table also shows Rate of Improvement, which can be useful for setting goals. 19
The End 20