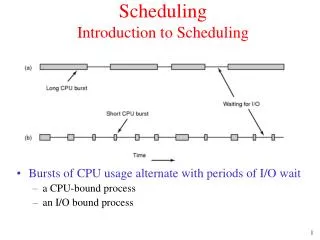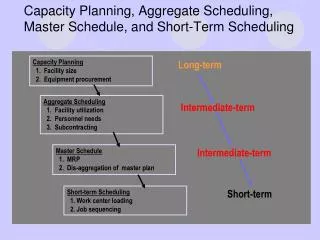
Scheduling Capacity
This report outlines the findings from the February 28-March 1, 2013 team visit focused on assessing the utilization rates of 110 classrooms and 210 teaching labs. Analysis of data shows weekly utilization hours, average room usage, and student station hours. Recommendations include optimizing scheduling models and exploring alternative meeting times to accommodate growth over the next five years. The findings indicate potential for increased CRNs through extended hours, hybrid classes, and improved space efficiency amidst projected increases in student enrollment.

Scheduling Capacity
E N D
Presentation Transcript
Scheduling Capacity Plant Survey Team Visit February 28-March 1, 2013
Classrooms/Labs Fall 2011 Utilization • 110 Classrooms • 72 Rooms • Weekly Hours = 2,992 • Weekly Average = 42 • Room Utilization = 104 • Weekly Student Station Hours = 100,226 • Station Util. Std. Room use = 118 • Station Util. Actual Use = 65 • 210 Teaching Labs • 42 Rooms • Weekly Hours = 1,146 • Weekly Average = 27 • Room Utilization = 1,434 • Weekly Student Station Hours = 38,806 • Station Util. Std. Room use = 154 • Station Util. Actual Use = 91
Preliminary Conclusion • Limited space • 1st week of Classes • Break-out sessions • Hybrids • Current timeslots • After add/drop • Faculty Meetings • Student Meetings • Maintenance
Projecting Space Needs • Improve current model • Currently using: MW or WF, TR, some S, plus 1x a week classes • Optimized model • MWF, TR • S • Lengthen days • Hybrids • 1st week of classes
Projecting Space Needs Following slides show results based on proposed schedule(s) Following slides show # of CRNs, Ave # of students, and year – 110 Rooms 8:00am-9:50pmMWF & TR16 CRNs 8:00am-9:50pm MWF & TR & S18 CRNs 7:30am-10:20pmMWF & TR & S20 CRNs Without AB9 and With AB9 7:30am-10:20pmMWF or TR Fall 2013-Fall 2017 7:30am-10:20pmMWF or TR or S Fall 2014-Fall 2018 Without AB9 and With AB9
110 Rooms Fall 2012 Raw Data Hours: 8:00am-9:15pm MW or WF or TR & some S Information on Proposed Hours Hours: 7:30am-10:20pm MWF or TR or S
Information based on Proposed HoursHours: 7:30am-10:20pmMWF or TR110 RoomsFall
Information based on Proposed HoursHours: 7:30am-10:20pmMWF or TR or S110 RoomsFall
210 Rooms Fall 2012 Actual Information Hours: 8:00am-9:15pm MW or WF or TR Information on Proposed Hours Hours: 7:30am-10:20pm MWF or TR
Information based on Proposed HoursHours: 7:30am-10:20pmMWF or TR210 RoomsFall
Projecting Space Needs • AB9 • 20 (110) rooms • 4 (25 seats) • 1 (30 seat) • 6 (50 seat) • 1 (70 seat) • 6 (100 seat) • 1 (200 seat) • This is a gain of 1,360 seats • 4 (210 rooms) • 2 (36 seat) • 1 (54 seat) • 1 (72 seat) • This is a gain of 198 seats
Without AB9 With AB9 • 110 Rooms • With current meeting days/times • Average of 38 students in 2014 • 15 CRNs in 201508 • With proposed times, including Saturdays • Average of 38 students in 2014 • 18 CRNs in 2018 • 110 Rooms • With proposed meeting days/times, including Saturdays • Average of 38 students in 2018 • Potential of 20 CRNs
Without AB9 With AB9 • 210 Rooms • With current meeting days/times • Average of 31 students in 2015 • 9 CRNs in 2017 • With proposed times, including Saturdays • Average of 32 students in 2016 • 9 CRNs in 2017 • 210 Rooms • With proposed times, including Saturdays • Average of 32 students in 2017 • 8 CRNs in 2017 • Potential of 11-13 CRNs
Final Conclusion – 110 (does not include unknown increase factors for maintenance and other Academic & University Activities) • With no changes • Average of 38.2 students in 2014 • 15 CRNs in 2015 • With extended times • Average of 38.2 students in 2014 • 18 CRNs in 2018 • With extended times and Saturdays • Average of 38.2 students in 2014 • 18 CRNs in 2018 • With extended times and AB9 • Average of 37.7 students in 2018 • 14 CRNs in 2018 • With extended times, including Saturdays • Average of 37.7 students in 2018 • 14 CRNs in 2018 • Potentially to reach 20 CRNs With extending our meeting days/times and incorporating AB9, we could accommodate student growth for at least five more years.
Final Conclusion – 210 (does not include unknown increase factors for maintenance and other Academic & University Activities) • With no changes • Average of 30.7 students in 2015 • 9 CRNs in 2017 • With extended times • Average of 30.7 students in 2015 • 9 CRNs in 2018 • With extended times and AB9 • Average of 31.5 students in 2017 • 8 CRNs in 2018 • With extended times and AB9, including Saturdays • Average of 31.5 students in 2017 • 8 CRNs in 2018 • Potential to reach 11-13 CRNs With extending our meeting days/times and incorporating AB9, we could accommodate student growth for at least five more years.
Final Conclusion • Increase space utilization • Break-out sessions • Different location • Hybrids • Effectively share rooms • Off-campus • Non-traditional space • Saturdays • Current timeslots • Meeting times extended –additional Saturday sections • Gain from current average of 13 to 18-20 CRNs in 110 rooms • Gain from current average of 7 to 10-13 CRNs in 210 rooms • After add/drop • Faculty Meetings • Student Meetings • Maintenance • Find alternate meeting location to allow an additional increase in the # of CRNs we could offer in each room