Download

1 / 79
900 likes | 1.33k Views
Integration of Renewable Energy. P.R.Raghuram GM, SRLDC prraghu@srldc.org. Outline of this presentation. Introduction Basics of Renewable Technologies Scenario of Renewable Energy generation in India Issues involved in Grid Integration of RE: International Experience The Road ahead.

E N D
Integration of Renewable Energy P.R.Raghuram GM, SRLDC prraghu@srldc.org
Outline of this presentation • Introduction • Basics of Renewable Technologies • Scenario of Renewable Energy generation in India • Issues involved in Grid Integration of RE: • International Experience • The Road ahead
Outline of this presentation • Introduction • Basics of Renewable Technologies • Scenario of Renewable Energy generation in India • Issues involved in Grid Integration of RE: • International Experience • The Road ahead
The future depends on what we do in the Present….Mahathma Gandhi
Drivers for Alternate energy sources • Oil crisis in 1970s • Dwindling/ limited natural Resources (Oil, Coal) • Energy Security • International mandate for development of CDM technologies and to reduce Carbon/ Sulpher/ Green House Gas emissions, phase out fossil fuel generation and develop alternate Energy sources • IPCC (Intergovernmental Panel for Climate Change) under UNEP(1998) • UNFCCC Rio De Janeiro 1992 • Kyoto protocol 1997 • Copenhagen Summit 2009 • Indian initiatives • NAPCC (National Action Plan for Climate Change) • JNNSM (Jawaharlal Nehru National Solar Mission)
Outline of this presentation • Introduction • Basics of Renewable Technologies • Scenario of Renewable Energy generation in India • Issues involved in Grid Integration of RE: • International Experience • The Road ahead
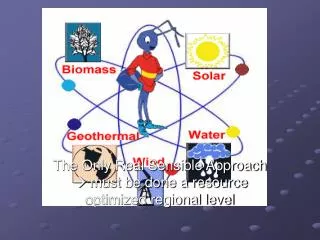
Various types of Renewable Energy • Wind • On shore • Off shore • Solar • Solar PV (Photo Voltaic, Concentrated PhotoVoltaic) • Solar Thermal (Solar Concentrated, Parabolic trough/dish, Fresnel collector, Heliostat & Solar Tower receiver, Solar updraft receiver) • Micro Hydel (upto 25 MW) • Biomass/ • Bagasse (the dry fibrous waste that is left after sugarcane has been processed) • rice husk, cotton stalk, mustard stalk, groundnut shell, coconut fronds, waste cotton stalks, bark, roots of trees, cane trash, arecanut shells, Prosopis juliflora, poultry litter) • Co-generation • Municipal Solid waste • Geo-Thermal • Hydro kinetics • Tidal power • Wave technology
Power vs Wind speed for a typical Induction type WTG where ρ= wind density, Cp is Power Co-efficient of Wind Turbine, λ is tip speed ratio, θ is the blade pitch angle, Ar = area of wind incidence on blades, v= wind speed Source: http://www.windpower.org
Types of Wind Generators [1, 2, 3, 4] Squirrel Cage Doubly Fed Direct Drive Induction Induction Synchronous Simple and Robust Less mechanical stress Less mechanical stress Less expensive Less noisy Less noisy Electrically efficient Aerodynamically efficient Aerodynamically efficient Standard generator Standard generator No gearbox Small converter Aerodynamically less Electrically less efficient Electrically less efficient efficient Gearbox included Gearbox included Large converter Mechanical stress Expensive Expensive Noisy Complex, heavy and large generator Oct. 2006 CREDP - Wind Farm Operation and Grid Integration 10
Electrical Characteristics of WTG • Reactive requirement: • Fault Ride Through (FRT) /Low Voltage ride-through (LVRT) • Governor operation available in WTG? • Inertia contribution to Grid? • Short circuit contribution • Can WTG be Black Started? Distributed Generation Systems reduce burden on Tranasmission system and reduce Losses
Increase in capacity In a mere 20 years, the yield Of wind turbines has increased 100-fold.With the new 6 MW Turbines, It will multiply another fivefold. 2010 6.000 kW 160 m 170 m appr.20,00,000 kWh Increase in capacity and efficiency: Development of turbine technology
Criteria for Site Selection SITE SELECTION – PLAIN TERRAINS SITE SELECTION – HILLY TERRAINS • High annual average Wind Speed ( > 7 m/sec.) • Wind Structure at The Proposed Site • Altitude of the proposed site. • Nature of Ground (soil for proper foundation / civil work ). • Favorable environmental condition to prevent corrosion & not prone to cyclone. • Availability of electrical infrastructure for evacuation of electricity generated . 2.5 D
CSP - TOWER TECHNOLOGY CSP - TROUGH TECHNOLOGY CSP - DISH TECHNOLOGY
Typical arrangement of an Small Hydro Power station SHP station on a river SHP station on a canal
Outline of this presentation • Introduction • Basics of Renewable Technologies • Scenario of Renewable Energy generation in India • Issues involved in Grid Integration of RE: • International Experience • The Road ahead
SR Maximum Wind -17.08.10 AT 18:59 HRS • % of Wind in SR I/C – 17% • % of Wind Gen in SR Demand Met – 14.9 % • % of Wind in TN I/C – 39.4 % • % of Wind Gen in TN Demand - 31.3 % WIND ENERGY HARNESSED Source : MNRE
Solar Map Wind Map Both Solar and wind concentration are geographically same
Diurnal patterns S-W monsoon N-E monsoon Seasonal patterns
Integration issues of Wind • Planning criterion for RE • Variability and Intermittancy • Forecasting and Scheduling • SCADA / telemetry • Network related Problems and Congestion • Protection • Commercial mechanism implementation
Planning Transmission system for RE Initially wind as an energy rather than capacity addition As the penetration of the wind increases, Wind treated interms of MW capacity Network development and O&M upto the pooling station by the wind developer beyond the pooling station by the Distribution licensee N-1 criterion to be maintained
Planning Transmission system for RE • Criteria used for Tr. Planning of Conventional power to be upgraded for RE • Studies for power flow, time-domain and small-signal stability along with short-circuit duty analyses tools • Trade off between network optimal utilization and redundancy • Dynamic Line Rating : During high wind periods the network can be loaded to a higher levels of thermal ratings of the network because of higher heat dissipation due to wind. This concept is called dynamic Line rating. • Diversity Factor : Wind farms are usually located across large geographical spreads, hence wind pattern for all the wind mills and wind farms is not the same, thus the wind production at a given point of time is not same for all the wind generators and farms. This is called Diversity factor and is to be duly factored while designing evacuation systems.
50Hz Load Generation Planning criterion for RE • Outage of wind generator should be planned during lean wind season, outage of solar, if required during the rainy season and outage of run-of-the-via hydro power plant in the lean water season.
Integration issues of Wind • Planning criterion for RE • Variability and Intermittancy • Forecasting and Scheduling • SCADA / telemetry • Network related Problems and Congestion • Protection • Commercial mechanism implementation
TN WIND GENERATION (28% of Energy) Intermittancy: not continuously available Variability : variable in magnitude Uncertainity : Variations may not be as Expected SR Maximum Wind -17.08.10 AT 18:59 HRS % of Wind in SR I/C – 17% % of Wind Gen in SR Demand Met – 14.9 % % of Wind in TN I/C – 39.4 % % of Wind Gen in TN Demand - 31.3 % TIME → Data taken from SCADA
KARNATAKA WIND GENERATION Karnataka can better manage variability due to Hydro as penetration increases, Difficult to manage TIME → Data taken from SCADA
TN WIND GENERATION MUs Data are as received from TN
Impact of Variability on Home state Wind generation typically varies from 800 to 2000 MWs. Increased requirement of spinning reserve Dip the system frequency due to absence of spinning reserve Increasing the spot market cost of power Host state having to resort to massive load shedding Additional costs of dispatch of Liquid generation to offset the drop in RE generation Any committed export through bilateral open access contracts can not be revised adding to the voes of the host state. Burden of Frequency Support Ancillary services Sudden Increase in RE generation- Thermal Gen backing down has limitations
DEALING WITH WIND VARIABILITY SPINNING RESERVE/ON CALL HYDRO ESTABLISHED METHOD IN MOST COUNTRIES ADDITIONAL SPINNING RESERVE MANDATED WITH INCREASED PENETRATION WHO BEARS THE COST? HYDRO AS HEDGE PUMPED STORAGE DINORWIG IN UK KADAMPARAI,SRISAILAM INDIA OPEN CYCLE GAS PLANTS GRID INTERCONNECTS TO HARVEST DIVERSITY FUTURE -STORAGE
Integration issues of Wind • Planning criterion for RE • Variability and Intermittancy • Forecasting and Scheduling • SCADA / telemetry • Network related Problems and Congestion • Protection • Commercial mechanism implementation
Need for Accurate Forecasting Maintain Load Generation balance Increasing penetration of RE Absence of spinning reserve Perennial deficits in Generation Effect of Higher Intermittency of RE Thrust on Market participation of RE Ensure level playing field to Buyers of RE Favorable policy to RE vis-à-vis Accountability of RE gen Forecasting with minimum accuracy of 30% for wind and 20% for Solar – IEGC mandate Day ahead forecast for 15 min time blocks
Uncertainity in a narrow band, Hence it is possible to Forecast Wind generation
How the Forecast is done? • Inputs : Meteorological data of Weather from satellites, Site topography, SCADA/ • current data of weather, power, and historical data of weather and power • Earth surface divided into a grid of 35x70km and Earth’s atmosphere into 64 layers • The meso scale models further divide the data into 2.5 sq km or 0.5 sq.km grid • A digital model of Flow modelling, wake effect, and turbine output • Forecast methods are based on statistical techniques involving Numerical Weather • Prediction (NWP), Adaptive techniques, Time Series Anlaysis, Climatology. • Inputs are fed to different Suite of models which are distinctly based on An intelligent • model will combine the results of these individual models and gives a best fit of results. • The results are continuously fine tuned by taking real time data inputs from wind • farms on live updates of wind speed, live SCADA and site geography. • Output :The wind forecast is based on Forecast process is done upto 16 days ahead, • In the first 7 days it is run for 3 hour intervals while for the remaining period it run for 8 hour intervals. • On day ahead basis, it is run for 4 times for a window of 6 hours with a granularity of 10 minutes, which has to be ultimately aligned with 15 min average values. • The errors will be lesser and uncertainty band will be tighter for shorter forecast horizons. Align forecast with Scheduling granularity
NWP Forecast NWP Forecast Historic SCADA Live SCADA Site geography NWP Forecast Suite of Models Climatology Adaptive statistics Time Series Model adaptation Intelligent Model Combination Wind speed forecast Live SCADA Optimised combination of NWP suppliers Incorporation of mesoscale models Regular live feedback from the wind farm “Learning” Algorithms for: Meteorology Power models Power model Model adaptation Power forecast Flow Diagram of a Forecast model
Comparison of Actual power with predicted Values Emphasis on Accuracy of Ramp Events
Aggregating of Forecast Geographic area-wise Control Area-wise Developer-wise Windfarm wise Seller-wise Bilateral vis-à-vis Collective 4.i) of Complementary Commercial Mechanisms of IEGC Day ahead forecast: Wind/ power forecast with an interval of 15 minutes for the next 24 hours for the aggregate Generation capacity of 10 MW and above. Mapping to Transaction-wise is important
Variability over a large Area is lesser Single Turbine A Windfarm A Control Area The forecast when aggregated on a larger Geo-graphical area will give lesser errors
Forecast to be furnished to Host Control Area For Operational planning and Real time Monitoring RLDC For Operational planning and Real time Monitoring For Checking the Schedule Vs Actual Forecast model to be adopted for Indian weather conditions Special Emphasis on Ramp Events Advance info on Forecast of Ramp Events to be given to System Operation at regular intervals and time horizons Common Control centre for co-ordinating with RLDC/ SLDC suggested
Forecast Data Flow to various functionalities Real Time Monitoring Reserve Balancing Telemetry Forecasting/ Scheduling Trading
Need for Scheduling leads to…… Forecasting Revising to minimise UI Real Time monitoring (SCADA requirements) Need to measure Actuals (Metering) UI accounting (pool participation) RRF
Scheduling applicability Wind farms with collective capacity >= 10MW Solar generating plants with capacity >= 5MW connected at >=33 KV level who have not signed any PPA with states/UTs/DVC or others Nodal developer to be identified for co-ordination for SCDA, Metering, Scheduling, UI Charges, RRF etc. Scheduling of RE w.e.f 01-01-12
How to accommodate Forecasted changes in Bilateral and Collective Schedules? No Revision allowed in Collective schedules Revisions upto a max 8 times in day ( 1 for each 3 hr time slot) allowed in bilateral Revisions after a 6 time block notice Treat Collective as Fixed and revise the Bilateral as per forecast changes +ve changes : Easier to Manage -Ve Changes : L-G balance and Frequency will be effected. How to manage Ramp Events?
Intervals for Revisions of Intra-day Bilateral Trade Schedules 3 hours 3 hours 3 hours 3 hours 3 hours 3 hours 3 hours 3 hours 6 blocks notice
Collective schedules can not be revised. Real time Deviations due to fixed collective schedules to be factored for operational planning Procedures for RRF mechanism :3.6. The concerned SLDC/RLDC will be responsible for checking that there is no gaming (gaming is an intentional mis-declaration of a parameter related to commercial mechanism in vogue, in order to make an undue commercial gain). Why limit Sale under Collective transactions (Px) ?