Download
1 / 25
250 likes | 281 Views
Explore stopping distances, thinking distance, and braking distance in vehicles. Learn factors affecting distances and calculate speeds through graphing experiments.

E N D
Stopping distances How long does it take a moving vehicle to stop? Thinking distance is the distance a car travels before the brakes are applied. The stopping distance is the sum of the thinking distance and the braking distance. Braking distance is the distance a car travels whilst the brakes are being applied. Braking distance Thinking distance Stopping distance Stopping distance = thinking distance + braking distance
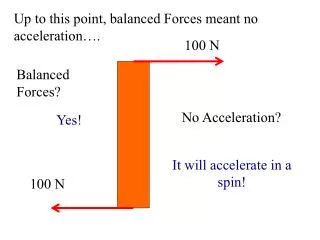
Can you match up the words with their definitions? One of forces the road exerts on the tyres as the car is stopping. The distance a car travels whilst it is braking. The distance a car travels before the brakes are applied. The sum of thinking distance and the braking distance. Stopping distance Friction Thinking distance Braking distance
What factors affect braking and thinking distance? Speed of car Speed of car Drugs and alcohol Road conditions Condition of tyres Tiredness Medication Condition of brakes Medication Condition of tyres Speed of car Drugs and alcohol Road conditions Tiredness Condition of brakes
Braking car question: • A car is moving along an open road. Suddenly, a sheep walks into the road. • What do we call the distance the car travels before the driver puts their foot on the brakes? • Name one factor that could increase the distance the car travels in this time. • The braking distance is 35m for the car. If the stopping distance is 50m, how far did the car travel before the driver put their foot on the brakes? Thinking distance Medication, drugs/alcohol, speed of car, tiredness Thinking distance = Stopping distance – braking distance = 50m – 35m = 15m
Car Graphing Activity This graphing experiment shows a movie of a car travelling along a straight road. Copy the results table shown on the next slide and complete it as the movie is played. Record the distance the car has travelled every five seconds. Then graph your results. Note that there are teacher’s notes, in “Notes View” on this slide. See teacher’s notes
0 16 76 186 234 484 634 784 904 974 994 994 Results table for Distance / Time Graph
The car is starting to move. The curve shows that the speed is changing. The curve is upwards as the car accelerates at the start of the movie. The car is going fast but at a constant speed. The line is straight in this region of the graph. The car has stopped: The line is flat – the distance of the car from the start point is not changing. The line is straight – meaning that there is no CHANGE in speed. The line on the graph is not straight, so we know the speed of the car is changing. The curve is downwards as the car slows down at the end of the movie.
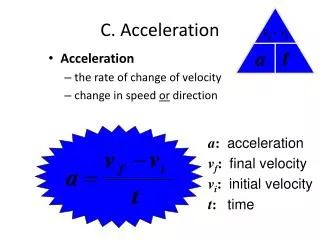
Gradient of a Distance / Time Graph The speed of the car can be calculated by looking at the gradient of the Distance / Time graph. Speed is “Distance Travelled divided by Time Taken” Both these values can be read off the Distance / Time graph, and this is the same as the gradient of the line.
Look at the straight line part of this graph shown by the two arrows in a triangle. The car has travelled from 200m to 800m, = 600m The car has taken from 16s to 36s to travel this distance = 20 seconds Therefore the speed is 600 divided by 20 = 30 m/s
Plotting the Speed / Time Graph Having looked at the distance-time graph, plot the speed-time graph. Copy the results table shown on the next slide and complete it as the movie is played. Record the speed of the car at five second intervals. Then graph your results.
0 6 16 26 30 30 30 30 20 10 0 0 Results table for Speed / Time Graph
The car is at rest here – with zero speed Car is accelerating here – the speed is increasing. The car is going at constant speed – acceleration is zero. The car is decelerating here – or slowing down
From both graphs we can see that the speed is 30 m/s. (Using the value calculated previously) The speed is decreasing and the curve is downwards The speed is zero – the car is not moving – and we can see that the distance that the car has travelled is not changing either. The speed is increasing, and we can see that the Distance / Time graph curves upwards. Now compare the Speed / Time graph with the earlier Distance / Time graph
Speed = Distance ÷ Time S =d/t S=d/t We can express the speed formula using the equation: Speed measured in metres per second (m/s) Distance measured in metres (m) Time measured in seconds (s)
Formula triangles Formula triangles help you to rearrange formula, the triangle for the speed formula is shown below: Whatever quantity you are trying to find cover it up and it will leave you with the calculation required. …and you are left with the sum… So if you were trying to find speed, s….. s = d t d …you would cover s up… s t x
Speed of vehicles Use the speed formula, s=d/t, to calculate the speeds of various vehicles. Measure out a known distance, say 100m, alongside a road. Record the time it takes vehicles to cover the distance. 100 m Measure the speed of at least 20 vehicles and then represent your data graphically.