Download
1 / 29
300 likes | 323 Views
Exploring the impact of oxidation on the optical constants of heavy metals in the Extreme Ultraviolet (EUV) range. Discusses methodology like X-Ray Photoelectron Spectroscopy and Depth Profiling to determine material properties.

E N D
Oxidation Effects on the Optical Constants of Heavy Metals in the Extreme Ultraviolet Amy Grigg R. Steven Turley Brigham Young University
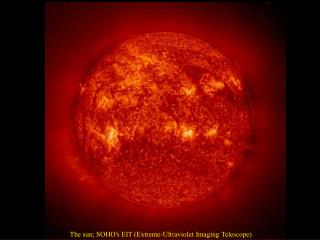
Why Extreme Ultraviolet? Thin Film or Multilayer Mirrors EUV Lithography Soft X-Ray Microscope Earth’s Magnetosphere in the EUV
Oxidation Problem • High absorption requires thin films. • The surfaces of many materials oxidize. • At optical wavelengths, this oxidation is often negligible. It is a major issue for our thin films, however.
Th 4f5/2 4f7/2 Th O 4d3/2 4d5/2 1s Th C 5d3/2 5d5/2 1s Electron Binding Energy
Peak Shifts • Thorium peaks on surface • Thorium peaks after oxygen is gone
Depth Profiling: Method 1 • Sputtering: Argon ions knock off individual atoms and drill a hole through the sample
Analyzer X-ray Source e- θ e- e- Sample Depth Profiling: Method 2 • Variable angle scans: Depth is obtained as the analyzer is moved towards incidence
Variable Angle Results • Only penetrates about 80 Angstroms into the sample • This allows us to see surface contamination, but not composition with depth • Results are averaged: cannot obtain resolved composition with depth
Results • This isn’t the true interface because the probability of electron escape is exponential with depth • Ideal interface:
Results • Si interface is not ideal • This is likely due to the sputtering process • Implantation • Sputtering roughness • Shape of sputtered area
Too Much Oxidation • These samples were only a few hours old. • We need more uniformity for single-layer reflectors. • Solution: Make ThO2 mirrors. Reflection is also high in EUV and it should be more uniform.
ThO2 Conclusions • Fully oxidized thorium is much more uniform. • ThO2 shows definite promise as a single-layer reflector in the EUV.
Ultimate Goal • Determine the optical constants of our materials
Fitting Reflection/Transmission • Others have taken the oxide layer into account, but have assumed an ideal interface • Measured oxidation (XPS) shows that our approximation is inaccurate
Put the Data to Use • Incorporate what we know about oxidation into the way we determine our optical constants. • Write a data-fitting program Inputs: measured oxidation, reflection/transmission data Outputs: optical constants of measured element (δ and β)
Data-Fitting Program • Task: Find the most likely optical constants (δ and β) to have produced the measured data that is input • Least squares routine: Minimize
Function • Function f uses Matrix Method with Fresnel coefficients to determine theoretical reflection and transmission
Continued Research • Make a sample, measure it with XPS, model the oxide layer with the program based on the XPS results, and test method • Make user interface for program if method works well • Determine cause of non-ideal Si interface
Acknowledgements A special thanks to R. Steven Turley David Allred Matt Linford BYU Thin Films Group Physics & Astronomy Department Funding ORCA Mentoring Grant NASA Space Grant Images from www.schott.com/magazine/english/info99/ and www.lbl.gov/Science-Articles/Archive/xray-inside-cells.html.
Other Results of Interest • There was an increase in oxygen when the sample sat for more than 4 or 5 minutes in between sputtering/scans. • This was observed for 5 out of 5 samples that sat still between scans.
* * * * * indicates where the sample stood for more than 4 or 5 minutes in between scans
What Could This Be? • Hypothesis: This is likely due to preferential sputtering. • The argon ions will knock off oxygen atoms more readily than thorium. • While sputtering, scans would show less O than actually exists.
Future Research • Test preferential sputtering hypothesis. • Investigate other peak anomalies: N, Ar