Download
1 / 40
400 likes | 527 Views
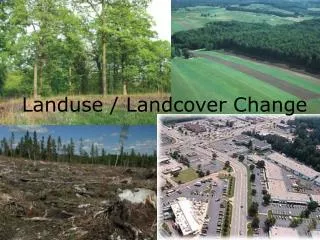
The Landuse Evolution and Impact Assessment Model. L E A M. a distributed modeling environment. Brian Deal Don Fournier. Problem: Rampant Urban Growth. Southern California urbanization. environmental impacts water quality and quantity.

E N D
The Landuse Evolution and Impact Assessment Model L E A M a distributed modeling environment Brian Deal Don Fournier
environmental impactswater quality and quantity • each year more than 100,000 acres of wetlands are destroyed, in large part to build sprawling new developments • wetlands can remove up to 90 percent of the pollutants in water • wetlands destruction leads directly to polluted water • sprawl increases the risk of flooding • development pressures lead to building on floodplains • in the last eight years, floods in the United States killed more than 850 • people and caused more than $89 billion in property damage • much of this flooding occurred in places where weak zoning laws allowed developers to drain wetlands and build in floodplain ·
a dialogue is needed • as competition for land has intensified, so has disagreement over how to balance economic use and conservation of natural resources • the lack of a genuine dialogue between advocates of public and private interests has led to a paralysis of effective decision making at every level of government a decision support system is needed to improve the gaps in our basic understanding of the urban community, their dynamics and transformation, resource requirements, and landscape sustainability
data decisions models impacts what should an urban transformation DSS include? • spatial and dynamic • publicly accessible • web based and easy to use • (democratized) • graphic • be able to integrate submodels • capture feedback between systems • open architecture for ease of modification and calibration • distributed computational environment • it should include multiple scales • multiple landuse change factors including: • physical, social and economic drivers • be able to produce what-if landuse planning scenarios • impact evaluation (so what?) • global climate change impacts, economic, environmental and societal impacts • transportable • interdisciplinary
dynamic spatial modeling • provides a forum for understanding the implications of spatial problems • visualization of the problem • discount rates • personal vs. societal A AS J TP
leamthe landuse evolution and impact assessment model • a dynamic spatial modeling environment • distributed modeling approach • scenario based planning tool • societal and environmental impact assessment • planning decision support tool University of Illinois NSF USGS NCSA TRIES ERDC - CERL
a scenario based spatial decision support tool outcome scenarioX LEAM decision scenarioY outcome
critical components • process based modeling environment • feedback • impact assessment • environmental • social • economic • open architecture • contextual experts • visualization advancements • democratization • spatial and dynamic • publicly accessible • be able to integrate submodels • capture feedback between systems • open architecture for ease of modification and calibration • distributed computational environment • it should include multiple scales • multiple landuse change factors including: • physical, social and economic drivers • be able to produce what-if landuse planning scenarios • impact evaluation (so what?) • global climate change impacts, economic, environmental and societal impacts • transportable • interdisciplinary
economic population social geography transport open space neighbor- hood random fiscal energy waste environ water air habitat tes L E A M model drivers simulation planning group planning group landuse change impact assessment sustainable indices
PRICE DEM OPEN SPACE SWITCH ECON TRENDS ECONOMICS SOCIAL MODEL DEV PROBABILITY UTILITIES SPONTANEOUS NEIGHBORS PLANNING MAP GROWTH TRENDS TRANSPORTATION MODEL development probabilities • open space • DEM • economics • social models • utilities • spontaneity • organic • growth trends • transportation model
spatial datainputs • USGS • 7.5 Minute DEM quads • NLCD Land Use Classification data • DLG Roads data • USDA • SSURGO data • County Soil Surveys • State Geological Survey (e.g. ISGS) • 100 Year Flood Zone data • Municipal Boundaries data • State Dept. of Transportation (e.g. IDOT) • Annual Average 24 hour Traffic Volume Maps • County Development Dept. (e.g.Kane County Development Dept.) • Growth and Development Policies / Maps
organic growth • simulates the expansion of established cells • cells that have two or three urbanized neighbors are evaluated to determine whether each will become a new urbanized cell
diffusive growth • diffusive growth uses resource availability and probabilistic modeling techniques to determine the likelihood of development. All urbanized patches (res, com, rds,..) diffuse “resources” and influence the probability of further development • resources can be available utilities (potable water, sewer, electricity, etc.) and economic or other resources available to the community
spontaneity • simulates the influence of randomized urban development • if a randomly-drawn location passes a test of development suitability, it becomes a new urban location
economics • population growth is responsible for the housing demand • based on the statistical household-size predictions of Kane-County • economic sector is the important factor that “decides” if the existing demand can be realized or if the particular budget constraint is too high • the demand for houses influences the average house price • rising over time in response to increased demand
growth areas • different spatial entities have varying growth rates • aggressive vs passive communities
DEM • elevational restrictions and probabilities
transportation drivers • The Goals • Understand the importance of transportation in the development process. • Understand connection between vehicle trips and increased development, as well as vehicle congestion & site un-attractiveness
transportation • Road Access • the probability for the environmental change of a cell is affected by road proximity • Road Capacity • a development probability based on road capacity • road capacity interacts with congestion factor • Congestion • the level of road congestion affects the probability of development • Cost Surface Map • depicts the ease of passage over particular land uses • Transportation Drainage Map • calculates least time cost route • transportation “watersheds” • drain auto uses to calculate congestion coefficients
vehicle ‘sheds’ • Vehicle-shed Concept & “Drainage” Process • Algorithm using Cost-surface Map and Roads file. • Creates Vehicle-sheds at Federal and State Highway scales to compute congestion. • Watershed drainage concept adjusted for vehicles. • Assumption that all vehicles “drain” toward downtown Chicago, IL. • Probability for Development considers congestion. • decreases with increasing vehicle traffic • decreases when congestion begins to impede vehicle flow. • consequently, Cell “attractiveness” diminishes with increasing congestion. • Road Capacity and Outside vehicle inputs considered.
vehicle trips • Current land use of Cell determines trip number • Traffic Counts • Outside inputs of the model. • Rate of outside input calculated from 1965-1992 data. • Annual Average 24 Hour Traffic Volume ( IDOT & USDOT ). • Results in a Development Probability due to Transportation • Factored into the development model. • Future Modifications • Value of Multiple Attractors? • Distance Considerations • Self-regulating capability portion of the 1965 vehicle trip map for Kane County
simulation simulation output
leam modelDundee Township 100,000 cells
county model 1,000,000 cells
landuse change training energy waste environ water air habitat tes impact assessment sustainable indices impact assessments So what?
water quality MONTHLY RAINFALL • Estimates amount of N (nitrogen), P (phosphorus) and SS (suspended solids) • Runoff Curve Numbers method developed by Soil Conservation Service, USDA • Variables • NLCD category • Land use category read from the map • Obtained from USGS • MONTHLY RAINFALL • 20yrs average monthly rainfall of Aurora • Obtained from NOAA • SOIL TYPE • Hydrological soil group • Original data obtained from USDA and reclassified to HSG • S and CN • S: Potential maximum retention after runoff begins • Determined by CN DATA INPUT Area Q in cm S Amount of Runoff CN N Factor NLCD Category N in Runoff
economic impacts • Why study the costs?? • Provide useful information to planners and policymakers for a more comprehensive evaluation of alternative urban forms • How do we approach it? • Source out all relevant contributing costs-factors, social/environmental, market and private • Methodology: • Costs set within Leam framework roads utilities schools societal environmental
impacts impacts • climate change • biodiversity • water quality • surface/subsurface hydrology • energy • associated externalities • air quality • habitat loss/fragmentation • economic impacts • social impacts • quality of life • drive times
impacts sustainability indices • Ecological Indicators • Water use vs. availability • Solid waste generation vs. landfill capacity • Sewage generation vs. processing capacity • Energy use and emissions • Economic Indicators • Cost per household of infrastructure • Social Indicators • Open space per capita • Social cost of loss of land • Presence of native wildlife • Mission related indicators • Training lands • Energy availability the development of regional sustainable indices as they relate to community interaction variables, climate change, ecological factors and urban risk assessments
decisions leambeta version
conclusions • The LEAM modeling environment presents a novel way of representing landuse change models. The 30-meter x 30-meter resolution of the model represents more clearly, we believe, the social dynamic present in landuse change decision making. The use this resolution enables the introduction of variables that can not be represented in larger scaled models. • Dynamic spatial modeling is important for the development of a robust landuse decision support system (DSS). The DSS should include: • evaluation criteria for: global climate change impacts, economic, environmental and socially based landuse interactions • landuse policy scenarios and given evaluation criteria to determine future environmental and landuse sustainability impacts • infrastructure and community based landuse assessment models to assess impacts, resource requirements, and salient linkages • a set of regional sustainable indices as they relate to community interaction variables, climate change and urban risk assessments The overall goal of the DSS should be to improve the gaps in our basic understanding of the urban community, resource requirements, and landscape sustainability.