Download
1 / 1
10 likes | 118 Views
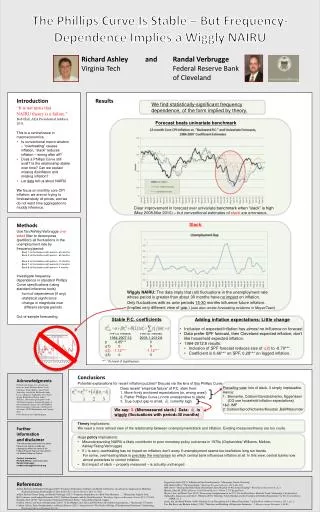
The Phillips Curve Is Stable – But Frequency-Dependence Implies a Wiggly NAIRU. Richard Ashley and Randal Verbrugge Virginia Tech Federal Reserve Bank of Cleveland. Introduction “It is not news that NAIRU theory is a failure.”

E N D
The Phillips Curve Is Stable – But Frequency-Dependence Implies a Wiggly NAIRU Richard Ashley and Randal VerbruggeVirginia Tech Federal Reserve Bank of Cleveland • Introduction • “It is not news that • NAIRU theory is a failure.” • Bob Hall, AEA Presidential Address, 2011. • This is a central issue in macroeconomics. • Is conventional macro wisdom – “overheating” causes inflation, “slack” reduces inflation – wrong after all? • Does a Phillips Curve still exist? Is the relationship stable over time? Can we explain missing disinflation and missing inflation? • Let data tell us about NAIRU • We focus on monthly core CPI inflation: we are not trying to forecast/study oil prices, and we do not want time aggregation to muddy inference. Results We find statistically-significant frequency dependence, of the form implied by theory. Forecast beats univariate benchmark Clear improvement in forecast over univariate benchmark when “slack” is high (May 2008-Mar 2010) – but conventional estimates of slack are erroneous. • Methods • Use Tan/Ashley/Verbrugge one-sided filter to decompose (partition) all fluctuations in the unemployment rate by frequency/period: • Band 1: all fluctuations with period > 60 months • Band 2: all fluctuations with period ~ 60 months • : • Band 6: all fluctuations with period ~ 12 months • Band 7: all fluctuations with period 4-10 months • Band 8: all fluctuations with period < 4 months • Investigate frequency-dependence in standard Phillips Curve specifications (using standard inference tools) • -form of dependence (if any) • -statistical significance • -change in magnitude over different sample periods • Out-of-sample forecasting Slack: Wiggly NAIRU: The data imply that (all) fluctuations in the unemployment rate whose period is greater than about 30 months have no impact on inflation. Only fluctuations with ex ante periods 15-30 months influence future inflation. (Implies very different view of gap.) (see also unrate forecasting evidence in Meyer/Tasci) Stable P.C. coefficients Adding inflation expectations: Little change • Inclusion of expected inflation has almost no influence on forecast • Data prefer SPF forecast, then Cleveland expected inflation; don’t like household expected inflation. • 1984-2012:8 results: • Inclusion of SPF forecast reduces size of (2) to -0.70***. • Coefficient is 0.66*** on SPF, 0.28*** on lagged inflation. • Pre-Gt. Recess. Post-Gt. Recess. • 1984-2007:122008:1-2012:8 • 0.85*** 0 • (1) 0 0 • (2) -1.12*** -1.12*** • (3) 0 0 ***: 1% level of significance. • Conclusions • Potential explanations for recent inflation puzzles? Discuss via the lens of this Phillips Curve. • Theory implications: • We need a more refined view of the relationship between unemployment/slack and inflation. Existing measures/theory are too crude. • Huge policy implications: • Misunderstanding NAIRU a likely contributor to poor monetary policy outcomes in 1970s (Orphanides/ Williams, Meltzer, Ashley/Tsang/Verbrugge) • If is zero, overheating has no impact on inflation; don’t worry if unemployment seems too low/below long run trends. • For some, overheating/slack is precisely the mechanism by which central bank influences inflation at all. In this view, central banks now almost powerless to control inflation. • But impact of slack -- properly measured – is actually unchanged. Acknowledgments Related work began over a decade ago; hence we thank Marianne Baxter, Larry Christiano, Walter Enders, Jonas Fisher, JordiGali, Josh Gallin, Ed Knotek, Andy Levin, AthanasiosOrphanides, Steve Reed, Jeremy Rudd, Mark Watson, John C. Williams, and seminar participants at the 2003 North American Summer Meetings of the Econometric Society, the 2004 Midwest Macroeconomics Conference, the Board of Governors, SUNY-Binghamton, and Virginia Tech. Poster design from Colin Purrington. Prevailing view: lots of slack, 3 simply implausible. Hence: 1: Bernanke, Coibion/Gorodnichenko, Eggertsson (CG use household inflation expectations) 1&2: IMF 2: Coibion/Gorodnichenko/Koustas,Ball/Mazumder Does recent “empirical failure” of P.C. stem from: More firmly anchored expectations (or, wrong ones!) 2. Flatter Phillips Curve (now unresponsive to slack) 3. Trueoutput gap is small, currently high We say: 3. (Mismeasured slack.) Data: is wiggly (fluctuations with period>30 months) Further information and disclaimer The views expressed herein are solely those of the authors and do not necessarily reflect the views of the Federal Reserve Bank of Cleveland or the Federal Reserve System. Contact information: Richard Ashley: ashleyr@vt.edu Randal Verbrugge: randal.verbrugge@clev.frb.org References Ashley, Richard, and Randal Verbrugge (2009) “Frequency Dependence in Regression Model Coefficients: An Alternative Approach for Modeling Nonlinear Dynamic Relationships in Time Series” Econometric Reviews, 28(1–3), 4-20. Ashley, Richard, Byron Tsang, and Randal Verbrugge (2013) “Frequency Dependence in a Real-Time Monetary …” Manuscript, Virginia Tech. Ball, Laurence, and SandeepMazumder (2011) “Inflation Dynamics and the Great Recession.” Brookings Papers on Economic Activity 42.1, 337-405. Bernanke, Ben (2010) “The Economic Outlook and Monetary Policy.” Jackson Hole Speech, August. Coibion, Olivier, and YuriyGorodnichenko (2013) “Is the Phillips Curve Alive and Well After All? Inflation Expectations...” Manuscript, UT Austin. Coibion, Olivier, YuriyGorodnichenko, and Dmitri Koustas(2013) “Amerisclerosis? The Puzzle of Rising US Employment Persistence” forthcoming, Brookings Papers on Economic Activity. Eggertsson, Gauti (2013) “Inflation and the Great Recession.” Manuscript, Brown University. Hall, Robert (2011) “The Long Slump.” American Economics Review 101.2, 431-469. IMF (2013) “The Dog that Didn’t Bark: Has Inflation Been Muzzled Or Was It Just Sleeping?” World Economic Outlook, ch. 3. Meltzer, Allan H. (2010) A History of the Federal Reserve, Volume 2. U Chicago Press. Meyer, Chris, and Murat Tasci (2013) “Forecasting Unemployment in the U.S: Use the Flow Rates, Mind the Trend” Manuscript, Cleveland Fed. Orphanides, Athanasios and John C. Williams (2013) “Monetary Policy Mistakes and the Evolution of Inflation Expectations” in The Great Inflation, NBER, ch. 5. Stock, Jim, and Mark Watson (1999) “Business Cycle Fluctuations in US Macro Time Series.” in Handbook of Macroeconomics, Vol. 1, ch. 1. Tan, Hui-Boon, and Richard Ashley (1999). “Detection and Modeling of Regression Parameter….” Macroeconomic Dynamics 3, 69-83.