Download
1 / 16
160 likes | 278 Views
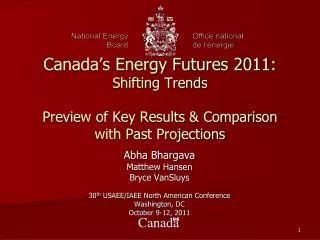
Canada’s Energy Futures 2011: Shifting Trends Preview of Key Results & Comparison with Past Projections. Abha Bhargava Matthew Hansen Bryce VanSluys 30 th USAEE/IAEE North American Conference Washington, DC October 9-12, 2011. The NEB.

E N D
Canada’s Energy Futures 2011:Shifting TrendsPreview of Key Results & Comparison with Past Projections Abha Bhargava Matthew Hansen Bryce VanSluys 30th USAEE/IAEE North American Conference Washington, DC October 9-12, 2011
The NEB • An independent quasi-judicial regulatory tribunal established in 1959 • Two primary functions: • Regulatory mandate • Energy information mandate
Energy Futures - Background • Flagship product published since 1967 • Approximately every 4 years • Last Report in 2007, with reference Case Update in 2009 • Presentation focused on comparing trends between 2007, 2009 and 2011 projections • Key Objectives • Provide unbiased, relevant, comprehensive, expert analysis on energy supply, demand and its economic implications and serve as a reference • Provide stimulus for discussion with and amongst stakeholders • Inform policy and business decisions of key risks and uncertainties facing the energy future
NEB’s Integrated Energy Modeling Framework Key Inputs: energy prices, oil and gas drilling, supply costs, well productivity and decline rates, electricity unit level characteristics, and other relevant projections Natural Gas Model Crude Oil Model Informetrica Macroeconomic Model Energy 2020 (Energy Demand, Electricity) Refinery Balances Model NGL Model
2011 Energy Futures Methodology:Reference Case and Four Sensitivities Reference Case 2010-2035 High and Low Price Sensitivities Fast and Slow Economic Growth Sensitivities
Five sensitivities represent a wide range of possibilities *AAG=Average annual growth
At a glance: Canadian energy demand, supply and trade, 2010-2035
Energy supply at record levels • Unconventional production grows for oil, gas and electricity • Oil Sands becomes the dominant source of production more than tripling by 2035 • Tight and shale gas makes up for declining conventional gas production • Electric fuel mix becomes cleaner with changes to coal capacity
Canadian energy demand growth slows • Energy demand growth slows moderately compared to history • Residential energy use is nearly flat over the projection • Industrial sector grows the fastest • Changes in demand trends are the result of efficiency and conservation programs, and higher energy prices • Slowing economy and lower population growth are additional factors • Government programs result in biodiesel and ethanol demand increasing faster than other fuels
Supply – Demand trends have implications for trade and infrastructure • Supply and demand trends will effect energy trade • Oil – net oil available for export triples • Gas – net gas available for export declines until 2020, and flat for the remainder • Electricity – net electricity available for export nearly doubles • Supply side shifts (volume and location) will have implications for infrastructure
Crude Oil: 2011 oil projections surpass past projections Oil Sands Conventional East Coast
Natural Gas Production: lower gas prices, lower conventional (non-tight) production, varying tight gas projections, Mackenzie push-backs and varying LNG assumptions
Electricity Generation: 2011 projections have similar overall generation, with larger shares of gas and renewables, and less nuclear and coal
Demand growth similar to 2009 Reference Case in aggregate, but sectors tell a different story Residential Commercial Industrial Transportation
Recent EIA AEO Projections: Trends are shifting for the U.S. as well
Conclusions • Significant shifts have occurred in the last 5 years in the field of energy in North America • While supply of natural gas has seen an upside potential, demand for energy has come down • Tight oil plays is another success story seen across North America, with production increasing at least in the medium term • Electricity sector is seeing a growing share of renewables • For copies of the Energy Futures projections, see www.neb-one.gc.ca (includes detailed data appendices)


![Franchise Lost! TP: “ How many of you [600] really crave a new Chevy?” NYC/IIR/061205](https://cdn2.slideserve.com/4057400/slide1-dt.jpg)