Backpackers' Age vs. Trip Days: Linear Regression Analysis
E N D
Presentation Transcript
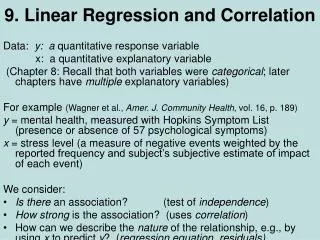
Linear Regression and Correlation Eight backpackers were asked their age (in years) and the number of days they backpacked on their last backpacking trip. Is there a linear relationship between the age of a backpacker and the number of days they backpack on one trip? Age # Days 20 17 40 8 34 8 40 10 58 7 50 7 26 12 70 3
Linear Regression and Correlation Age # Days 20 17 40 8 34 8 40 10 58 7 50 7 26 12 70 3 • First, do a scatterplot of the data, where age is the independent variable and # Days is the dependent variable. • Do the Linear Regression Hypothesis Test. Ho: ρ = 0 Ha: ρ ≠ 0
Linear Regression and Correlation • Calculator instructions: • Enter Age into L1 and # Days into L2. • Access LinRegTTest (STAT, TESTS, scroll to LinRegTTests) • Xlist is L1, Ylist is L2, Freq is 1, choose ≠, leave RegEQ blank, Calculate • The following will show on the calculator. • y=a + bx • t = -5.09 • p = 0.022 • df = 6 • a = 18.5286 • b = -0.2255 • s = 1.94 • r2 = 0.8112 (this is the coefficient of determination) • r = -0.901
Linear Regression and Correlation • Line of Best Fit or Least Squares Line yhat = a + bx: yhat = 18.5286 – 0.2255x Correlation: r = - 0.9011
Linear Regression and Correlation • Is the correlation, r, significant? (this is Method 1) • Because the pvalue = 0.0022 which is less than the assumed alpha of 0.05, we reject the Null Hypothesis. This means the correlation coefficient is significant and the line is a good fit. • We can plot the line and can use the line for prediction.
Linear Regression and Correlation • Is the correlation, r, significant? (this is Method 2) • Compare r = - 0.901 to the value in the 95% Critical Values of the Sample Correlation Coefficient Table at the end of chapter 12. • Since n – 2 = 8 – 2 = 6, the table critical value is – 0.707; negative r, use negative critical value. • Because -0.9011 < -0.707, r is significant. • We can plot the line and can use the line for prediction.
Linear Regression and Correlation TABLE 95% CRITICAL VALUES OF THE SAMPLE CORRELATION COEFFICIENT Degrees of Freedom: n - 2 Critical Values: (+ and -) 1 0.997 2 0.950 3 0.878 4 0.811 5 0.754 6 0.707 7 0.666 8 0.632 9 0.602 10 0.576
Linear Regression and Correlation • If age of backpacker = 45 years, how many days, on average, would he or she backpack? • yhat = 18.5286 – 0.2255(45) = 8.38 days • If age of backpacker = 32 years, how many days, on average, would he or she backpack? • yhat = 18.5286 – 0.2255(32) = 11.31 days • If age of backpacker = 90 years, how many days, on average, would he or she backpack? • yhat = 18.5286 – 0.2255(90) = -1.77 days • This answer makes no sense since 90 is outside the domain of the equation. (Reminder: 20 x 70)