Download
1 / 34
340 likes | 365 Views
Explore the zonal circulation cells and large-scale atmospheric patterns associated with El Niño-Southern Oscillation (ENSO) and the Pacific Walker Circulation. Learn about the impacts of these phenomena on global weather and climate patterns.

E N D
The Pacific Walker Circulation These zonal circulation cells exist because of large east-west gradients in the SST and under-lying thermal structure of the Pacific and Atlantic Oceans as well as heating of the tropical continental regions. The largest region of intense precipitation occurs over the Maritime Continent. Thunderstorms and heavy rain-fall are fueled by strong solar forcing, abundant evaporation from the warm Pacific and Indian Oceans, and sea-land breeze circulations that force convection on a daily basis. Schematics of the Pacific Walker Circulation
The Pacific Walker Circulation Schematics of the global Walker Circulation for Winter (DJF) based on computations of upper and lower tropospheric divergent winds. Latent heat release by these massive thunderstorm systems enhances rising motion and surface inflow from the east and west, thereby driving a strong circulation cell along the equator. Corresponding sinking motion occurs over the cool eastern Pacific. The large circulation cell over the Pacific was first described by meteorologist Sir Gilbert Walker. Large convective regions also occur with heating of tropical Africa and South America with sinking motion in between. Collectively, east-west circulation cells are referred to as the Walker Circulation.
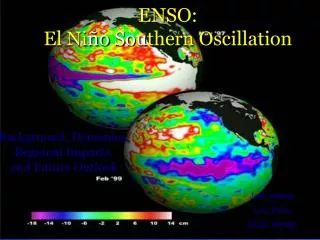
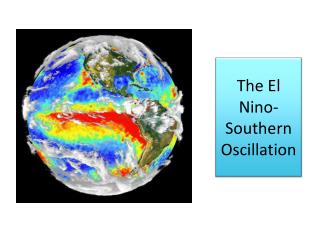
El Niño Southern Oscillation (ENSO) One of the most prominent aspects of our weather and climate is its variability. This variability ranges from small-scale phenomena such as wind gusts, localized thunderstorms and tornadoes, to larger-scale features such as fronts and storms to multi-seasonal, multi-year, multi-decade and even multi-century time scales. Typically, long time-scale events are often associated with changes in atmospheric circulations that encompass vast areas. At times, these persistent circulations occur simultaneously over seemingly unrelated, parts of the hemisphere, and result in abnormal weather, temperature and rainfall patterns worldwide. El Niño is one of these naturally occu rring phenomenon. The term El Niño (the Christ child) comes from the name Paita sailors called a periodic ocean current because it was obser-ved to appear usually immediately after Christmas. It marked a time with poor fishing conditions as the nutrient rich water off the northwest coast of South America remained very deep. However, over land, this ocean current were heavy rains in very dry regions which produced luxurious vegetation. From December 1997, this image shows the change of sea surface temperature from normal. The bright red colors (water temperatures warmer than normal) in the Eastern Pacific indicates the presence of El Niño.
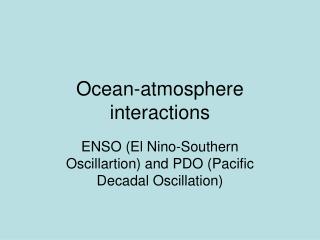
Further research found that El Niño is actually part of a much larger global variation in the atmosphere called ENSO (El Niño/Southern Oscillation). The Southern Oscillation refers to changes in sea level air pressure patterns in the Southern Pacific Ocean between Tahiti and Darwin, Australia. During El Niño conditions, the average air pressure is higher in Darwin than in Tahiti. Therefore, the change in air pressures in the South Pacific and water temperature in the East Pacific ocean, 8000 miles away, are related. ENSO is primarily monitored by the Southern Oscillation Index (SOI), based on pressure diffe- rences between Tahiti and Darwin, Australia. The SOI is a mathematical way of smoothing the daily fluctuations in air pressure between Tahiti and Darwin and standardizing the informa-tion. The added bonus in using the SOI is weather records are more than 100 years long which gives us over a century of ENSO history. Sea surface temperatures are monitored in four regions along the equator: Niño 1 (80°-90°W and 5°-10°S) Niño 2 (80°-90°W and 0°-5°S) Niño 3 (90°-150°W and 5°N-5°S) Niño 4 (150°-160°E and 5°N-5°S) These regions were created in the early 1980s. Since then, continued research has lead to modifications of these original regions. The original Niño 1 and Niño 2 are now combined and is called Niño 1+2. A new region, called Niño 3.4 (120°-150°W and 5°N-5°S) is now used as it corrolates better with the Southern Oscillation Index and is the prefered region to monitor sea surface temperature.
ENSO Evolution ENSO has an irregular, two to seven-year, cycle and large areal extent (the entire tropical Pacific), and its impacts are global. The oceanic component of ENSO, El Niño, is characterized by weakening of the trade winds and warming of SSTs in the Equatorial Pacific. El Niño or “Christ Child” originally referred to the appearance of warm water off the coast of Peru and Ecuador near Christmas time. It was noticed that in some years, the warming was stronger than others and disrupted local fishing. The local phenomenon has since been recognized as part of a global climate event. El Niño events typically last 9-15 months. La Niña is associated with stronger than normal trade winds and the anomalously cool SST. On average, La Niña is a less extreme anomaly than El Niño but tend to last longer, one to three years. El Niño to La Niña transitions occur much faster than La Niña to El Niño transitions; almost all El Niño to La Niña transitions occur in one year. SST and water temperature profile in the Equatorial Pacific Ocean illustrate how the upper ocean changes during the transition from normal to El Niño to the development stage of El Niña.
Time series of the Southern Oscillation Index and SST Anomalies in the Equatorial Pacific Ocean.
The ENSO signature is evident in the SST, mixed layer depth, upper ocean currents, and surface wind stress fields, and shift in the Walker Circulation Map showing the locations of Darwin and Tahiti Schematic of the upper ocean and atmospheric circulation during the El Niño and La Niña extremes
Delayed Oscillator Theory Delayed Oscillator Theory used coupled atmosphere-ocean dynamics, including convective heating in the atmosphere, explicit representation of the surface-layer dynamics and thermo-dynamics to determine the SST, and linear shallow-water dynamics along the equator. These coupled models show that a growing ENSO carries with it the seeds of its own demise. Time evolution for the idealized experimental waves generated in model moving Kelvin-Rossby wave
The onset of the 1997-98 El Niño marked by downwelling equatorial Kelvin waves triggered by westerly wind bursts
Linear Stochastic Theory The linear stochastic theory suggests that the development of El Niño and its demise occur in partial response to modulation of higher-latitude patterns by the global ENSO pattern in atmospheric moist deep convection. In essence, the couple ocean-atmosphere system is stable and ENSO events would not occur without external random forcing that cause SST growth or decay. Advective-Reflective Oscillator The Advective-Reflective Oscillator theory proposes that westerly wind anomalies induce anomalous eastward zonal currents. El Niño results from positive feedback of zonal currents that advects the western Pacific warm pool toward the east. The warm pool would be pushed back towards the west by zonal currents associated with wave reflection at the western and eastern boundaries, and by convergence of the mean zonal current at the eastern boundary of the Pacific.
Recharge/Discharge Theory The recharge/discharge theory postulates that, prior to El Niño, heat content builds up in the equatorial region; the heat is then “discharged” eastward and poleward during El Niño. Transport below the Ekman layer is the key to recharge and discharge. Schematic of ocean transport based on the recharge/discharge theory of ENSO. (Meinen and McPhaden 2002)
Western Pacific Oscillator • The Western Pacific Oscillator theory begins with condensation heating in the west central Pacific, which induces twin off-equatorial cyclones and westerly wind anomalies at the equator. • The anomalous wind stress deepens the thermocline and increases the SST in the east Pacific. Positive feedback between wind stress and SST leads to growth of the anomaly. Meanwhile the pair of cyclones raises the thermocline, so that SST decreases and sea level pressure increases off the equator in the west Pacific. • Anomalous high pressure induces easterly wind anomalies which causes upwelling and cooling. The cooling spreads eastwards and provides a negative feedback, thereby creating an oscillating coupled ocean-atmospheric system. • Unlike the delayed oscillator theory, this theory does not require wave reflection for the coupled ocean-atmosphere system to oscillate.
Indices Used to Monitor ENSO Evolution The NIÑO 3.4 region is considered to be most suitable for monitoring climate variability on global scales, as SST variability here signals the strongest effect on shifting precipi-tation patterns from the west to the central Pacific. It has also been observed that prognostic numerical weather models exhibit the highest skill when initializing with data from this region. • a. The Oceanic NIÑO Index (ONI) • The Oceanic NIÑO Index (ONI) is defined as the three-month average of sea surface temperature departures from normal in the NIÑO 3.4 region of the Pacific. The average values are based on homogeneous, historical SST analyses, the Extended Reconstructed SST. • El Niño periods are characterized by a positive ONI greater than or equal to +0.5°C. La Niña periods are characterized by a negative ONI less than or equal to -0.5°C. • To be classified as a full-fledged El Niño or La Niña episode these thresholds must be exceeded for at least five consecutive months. • b. Equatorial SOI • The equatorial SOI is defined as the standardized anomaly of the difference between the area-average monthly sea level pressure in an area of the eastern Pacific (80°W-130°W, 5°N-5°S) and an area over Indonesia (90°E-140°E, 5°N-5°S).The Equatorial SOI tracks closely with the Tahiti-Darwin SOI but with varying amplitude.
c. Japanese Meteorological Agency (JMA) Index The JMA index is defined by the 5-month running average of SST anomalies over the tropical Pacific (4°S–4°N, 150°W–90°W). A JMA index warm phase occurs when the 5-month running average of SST anomalies is greater than 0.5°C for at least six consecutive months including October to December. A cold phase occurs when SST anomalies are less than 0.5°C for at least six consecutive months including October to December. According to the JMA, an ENSO year begins in the October when the warm or cold phase forms until the following September. d. Tahiti-Darwin SOI The most commonly used atmospheric index is the Tahiti-Darwin SOI described previously. Normal Conditions (Non El Nino) El Nino Conditions
Two indicators of El Niño conditions, the NINO3 index and the Southern Oscillation Index (SOI), over the period 1865-1998. El Niño conditions are characterized by a high NINO3 index, and a low SOI. The NINO3 index is the deviation of the sea surface temperature with respect to normal conditions over the area 5°S-5°N, 150°W-90°W, and the SOI is the normalized sea-level pressure difference between Tahiti and Darwin. SOI made available by P. D. Jones, Climate Research Unit, Universtity of East Anglia (UK). The NINO3 Data were analysed on the basis of historical ship observations by Alexey Kaplan (Palisades, NY, USA).
Established Indices of Climate Variability with Global or Regional Influence
e. Multivariate ENSO Index (MEI) • The Multivariate ENSO Index (MEI) is based on the six main observed variables over the tropical Pacific: sea-level pressure, zonal and meridional components of the surface wind, sea surface temperature, surface air temperature, and total cloudiness fraction of the sky. • The MEI is computed over bimonthly seasons (Dec-Jan, Jan-Feb,…, Nov-Dec) for each variable. First, the individual variable fields are filtered spatially into clusters. Then the MEI is calculated as the first unrotated principal component of the six fields combined. • Various low-level wind indices, upper-level wind indices, and OLR anomalies are also used to monitor ENSO evolution. It should be noted that no single ENSO index is capable of representing all ENSO variability; as many as eight modes of variability are needed to fully characterize ENSO development. • The various ENSO indices serve a useful purpose for communicating the general state of ENSO to decision makers and the general public, e.g., the National Centers for Environmental Prediction (NCEP) ENSO alert system provides El Niño/La Niña watches, advisories, and intensity classifications. • However, the tropical Pacific can exhibit simultaneously characteristics of El Niño and La Niña (e.g., the east Pacific can be anomalously warm while the central Pacific is cold, as observed in the boreal summer of 2008).
Time series of the Mulitvaraite ENSO Index (MEI). The anomalies are relative to the reference period 1950-93.
Comparing El Niño and La Niña Atmospheric and Oceanic Anomalies The first composite of El Niño SST anomalies and surface wind fields was developed by Rasmusson and Carpenter in 1982.108 The extremely warm ocean mean and anomalous SSTs during a strong El Niño is a dramatic contrast to the relatively cool conditions during a strong La Niña. However, the two conditions are not mirror images. Anomalous warming spreads out from the eastern and central Pacific while maximum anomalous cooling is centered in the central Pacific and extends toward the northeastern Pacific. A similar pattern is evident in composite plots; the La Niña maximum is west of the El Niño maximum. SST mean and anomalies for (a) a strong El Niño and (b) as strong La Niña.
Comparing El Niño and La Niña Atmospheric and Oceanic Anomalies Longitude–time plots of anomalies of (a) SST (SSTA, °C), (b) normalized sea level pressure (SLPA, hPa). Top panels are El Niño composite, middle panels are La Niña (anomaly multiplied by -1) composite, and the difference between the two (warm–cold anomaly). Contour intervals are 0.2°C, 0.4 σ, respectively. The 95% statistically significant anomalies or differences are shaded. The El Niño composite consisted of 1951, 1953, 1957, 1965, 1972, 1976, 1982, 1987, 1991 periods. La Niña composite consisted of 1949, 1950, 1954, 1955, 1964, 1970, 1973, 1975, 1988 periods. From Larkin and Harrison (2002).
Comparing El Niño and La Niña Atmospheric and Oceanic Anomalies The corresponding pressure anomalies are also different. The low associated with El Niño is more confined to the eastern Pacific while the La Niña high pressure anomaly, extends farther west. The zonal and meridional wind anomaly plots are similar for both extremes except that the amplitudes are larger in the El Niño composite and the zonal wind anomalies are more farther west during La Niña. Longitude-time plots of the same composite periods except for (a) zonal wind (UA m s-1) and (b) meridional wind (VA, m s-1). The zonal wind anomaly is taken along the equator. The meridional wind anomaly plot is at 6°N where the amplitude is typically largest. Longitude-time plots of the same compo-site periods, except for (a) zonal wind (UA m s-1) and (b) meridional wind (VA, m s-1). The zonal wind ano-maly is taken along the equator. The meridional wind anomaly plot is at 6°N where the amplitude is typically largest.
Comparing El Niño and La Niña Atmospheric and Oceanic Anomalies While composite provide a general pattern of anomalies, it is important to note that no two El Niños or La Niñas are the same. ENSO anomalies vary in amplitude and extent. The strength and distribution of the ocean warming determines the atmospheric response and the extent of the climate impacts. For example, the 1986-87 El Niño had weak warming in the central equatorial Pacific and the impact on the atmosphere was also weak. SST anomalies through (a) warm event cycles and (b) cold event cycles. Comparison of SST anomal-ies during (a) two strong El Niño events and (b) two strong La Niña events.
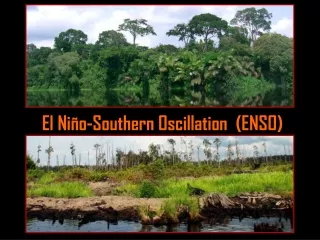
Climate Impacts related to ENSO As expected, most of the climate impacts of ENSO are felt in the equatorial Pacific and surroun-ding regions. Most notable is heavy precipitation and flooding in northwestern South America, especially in Peru, Ecuador, and Colombia during December to February of El Niño. Effects also include loss of fish and clam populations, which are important to the economy and food supply of the region. Meanwhile, in Australia and the Maritime Continent, the same period is marked by drought. Along with the drought comes wildfires and widespread smoke, which reduces visibility and leads to an increase in respiratory illnesses. El Niño has its strongest and most widespread impacts during the boreal winter. During the austral winter, El Niño impacts are weaker and felt mostly in the Southern Hemisphere. Although precipitation effects to increase as the intensity of El Niño and La Niña increase, events of similar intensity (as defined by Niño 3.4 anomalies) do not produce effects of the same magni-tude. The largest precipitation effects, as measured by the fractional area of tropical precipitation extremes, are observed during the strongest El Niño episodes (e.g., 1982/83 and 1997/98). The ENSO extremes lead to a displacement or disruption of the jet streams across North America. During a warm episode (El Niño) winter in the Northern Hemisphere, the subtropical jet stream shifts southward, displaces storm tracks to the southern US, enhances moisture flow from the Pacific, and leads to heavy rainfall across the southern US, Central America, and the Caribbean. In the United States, ENSO is known to influence temperature and precipitation distributions; frequency of generation of cyclones in the Gulf of Mexico; cloud cover; and a wide range of meteorological hazards including tornadoes, hurricanes, lightning, snow pack, and wildfires. Beneficial impacts of El Niño include warmer winters in Canada and the northern US and fewer hurricanes in the Atlantic. About 90% of the US has at least one statistically significant historical weather association with the intense 1997-98 El Niño.
Climate Impacts related to ENSO Climate Impacts related to ENSO El Niño during boreal (a) winter and (b) summer and corresponding La Niña impacts in (c) and (d), respectively.
Climate Impacts related to ENSO Tropical cyclone activity in the Atlantic (upper) and East Pacific (lower) the year before, during, and after El Niño. DJF lightning flash density (km-2) for (a) 1997-98 El Niño and (b) 2000-2001 La Niña. Adapted from LaJoie and Laing (2008).
Climate Impacts related to ENSO During La Niña, the probability of a hurricane making landfall is increased across the entire Caribbean, while El Niño periods have fewer hurricanes. The increase during the cold phase is due to more easterly upper-level wind, thereby favoring the formation of hurricanes in the deep Tropics while the warm phase is marked by strong upper-level westerly winds and increase in anticyclonic vorticity at in the lower troposphere. ENSO impacts are not symmetric; the influence of El Niño is strong over the northern Caribbean and weak over the east and west Caribbean while hurricane landfall probabilities increase across the entire region during La Niña. Impacts of ENSO vary spatially and temporally. For example, over Indonesia ENSO impacts on precipitation reaches a maximum during August and September. The impact is felt first in the east and moves westward until the peak in August. While the global map of ENSO impacts shows a large area of influence over Central America and the Caribbean, the regional effects are much more complex. While La Niña is generally more wet and El Niño drier, abnormally dry and abnormally wet periods occur during both El Niño and La Niña episodes and the regions of the extremes are not always collocated. Summer (JJAS) Rainfall over Central America and the Caribbean during El Niño and La Niña.
Forest fires in Indonesia and El Niño are strongly related. The line is an indicator for El Niño, in this case the NINO3.4 index (sea surface temperature anomaly over 5°N-5°S, 170°W-120°W). The asterisks indicate years with severe forest fires in Indonesia.
Extratropical Anomalies: Response to Tropical Anomalies ENSO impacts in the extratropics occur because some regions are particularly sensitive to variations in tropical heating associated with ENSO and the MJO. Tropical influences are felt preferentially in exit regions of the midlatitude jets. Heating over the Maritime Continent and nearby ocean has a great impact on the extratropics through Rossby wave trains that modulate the Pacific-North American (PNA) synoptic pattern. Interannual variability in the Atlantic is more closely related to the North American Oscillation (NAO) than ENSO. The NAO which is defined by pressure differences between the Azores and Iceland, has its strongest influence at high latitudes while the PNA influences the midlatitudes. Subtropical climates are sensitive to the position of the Subtropical Jet and the Atlantic ridge, which are controlled by the tropical ENSO and the extratropical PNA and NAO. Composite daily mean sea level pressure (hPa) during extreme El Niño condi tions, Feb. 1998, and extreme La Niña, Feb. 1989. The dramatic difference in the PNA pattern between strong El Niño and strong La Niña events(adapted from Hagermeyer 2006).
Attributing ENSO Impacts Since the strong 1982-83 and the recognition of its relationship to global impacts, the popular media has tried to link nearly all climate impacts to ENSO. While the ENSO signal is the most significant extreme of tropical interannual variability, it is not the only cause of seasonal and interannual variability. Since the strong 1982-83 and the recognition of its relationship to global impacts, the popular media has tried to link nearly all climate impacts to ENSO. While the ENSO signal is the most significant extreme of tropical interannual variability, it is not the only cause of seasonal and interannual variability. Other circulation patterns influence regional climate, we should be cautious in attributing various impacts to ENSO. Before an event can be classified as an ENSO influenced event, it is helpful to ask the following questions suggested by the IRI: 1. What is an ENSO impact, and what is not? 2. How consistently do the impacts occur during ENSO events? 3. How and why do the impacts vary from one event to another? Impacts attributed to the 1982-83 El Niño.
This figure is presents an illustration of the problems of attributing particular impacts to ENSO. In this instance, there are several steps between attributing a more intense jet stream to El Niño and CO poisoning among residents of poorly ventilated houses who used gas heaters after an ice storm. Each step has a level of uncertainty in attribution. Another potentially highly relevant question to consider is how ENSO modulates the behaviors of higher-frequency patterns—such modulation effects would not correlate linearly with ENSO, but would still be associated with it. An illustration of the problems and uncertainties in determining impacts of ENSO.
Forecasting ENSO Most predict the sea surface temperature in the equatorial Pacific. Two types of models are used, dynamical and statistical models. Dynamical models use the physical laws that govern the behavior of the atmosphere and the ocean to predict their future state. For example, Newton’s laws of motion are used to predict wind velocity. Mathe-matical representations of the physical laws are converted into computer programs. Increasing computational power facilitates the representation of more complex behaviors of the atmosphere and ocean in dynamical models. Statistical models use past observations to predict the future. A long period of record (30-50 years) is examined for trends, extremes, and relationships between ENSO related variables. For example, a basic statistical model would be a simple regression of westerly wind anomalies and SSTs for different regions of the equatorial Pacific. More complex statistical models use neural networks in which the model is trained to recognize precursor events and predict the probability of different ENSO conditions. In general, statistical models have greater forecast skill for short times (less than six months) but are less accurate for longer lead times. Dynamical models have seen improvements in their skill with the addition of various schemes by which real data is assimilated into the simulations. A look at current dynamical model forecast SST anomalies show that they have a wider spread of forecast values with roughly equal numbers having cold and warm biases (Fig. a). While statistical models have a smaller spread, they tend to have persistently warm or persistently cold biased forecasts (Fig. b).
Improvements in the seasonal forecast skill will benefit decision makers because the impacts of ENSO vary geographically and seasonally. For example, when the El Niño alert was given in May 1997, northwestern South America had less than a month to prepare for their period of greatest impact while other regions had a longer lead time to their period of maximum impact. While forecast models continue to improve, ENSO predictability is limited by a number of factors. Forecasts are more difficult from January to April (referred to the “spring predictability barrier”), which means that an El Niño is underway before the models will forecast its appearance. Stochastic processes, external forcing by weather events (white noise), help to maintain ENSO variability. ENSO is also modulated by decadal fluctuations such as the Pacific Decadal Oscillation. The geographic and seasonal distribution of large-scale precipi-tation anomalies asso-ciated with ENSO.