Download

1 / 32
320 likes | 411 Views
Explore the implications of immigration trends on US schools, including demographic changes and language challenges, based on data from the Immigration Studies Program at the Urban Institute. Learn about legal statuses, immigrant populations, and language abilities affecting students, parents, and schools. Gain insights into National Association for Bilingual Education and NCLB funding formulas. Understand the growth of immigrant students, limited English proficiency, and linguistic isolation. Discover how immigrant children are reshaping K-12 enrollment and the impact on different student populations.

E N D
Michael Fix & Jeffrey S. PasselImmigration Studies ProgramThe Urban Institute • U.S. Immigration -- Trends • & Implications for Schools National Association for Bilingual Education NCLB Implementation Institute New Orleans, LA January 28-29, 2003
Overview of Policy Issues • Immigration Trends -- Growth of Immigrant Population -- Geographic Dispersion -- Legal Status • Students & Language -- Growth of Immigrant Students -- Language Ability -- Students, Schools, Parents • NCLB Funding -- Formulas & Data
13-14+ (est.) Current In-Flows are Very High Europe/Canada (Legal) All Other (Legal) Additional* * Additional immigrants are mostly illegals and legalized aliens
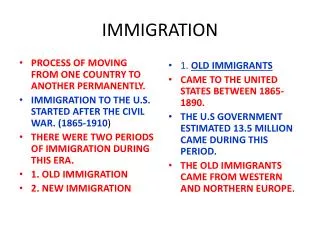
40 Million 31.1 Million (2000 Census) 14.8% 13% 11.1% (2000) 4.7% Percentage is Not Immigrant Numbers at Peak --
Who Comes to the U.S.? • Legal:600,000-750,000/year • Humanitarian: 70,000-125,000 down to 27,000 • Undocumented: Early ‘90s — 200-300,000 per year Late ‘90s — 500-800,000 or more Current — ???
Children of Immigrants are ... Immigrants are ... • 1 in 5 Children • 1 in 4 Low-Income Children • 1 in 9 U.S. Residents • 1 in 4 Low-Wage Workers Demographic Context
New Immigration Growth Centers Immigration Categories Major Destinations (67% of Immigrants) (6) New Growth States (1990-2000 > 91%) (22) Top 10 Growth States (135-274%) (10) All Other States (23)
Legal Status of Immigrants Legal Aliens (LPR) (10.0 million) 31% “Undocumented” Aliens (8.5 million) 26% Legal Nonimmigrants (1.5 million) 5% Naturalized Citizens (10.2 million) 31% Refugee Arrivals* (2.3 million) 7% Foreign-Born Population in 2000 (Based on March 2000 CPS, Census 2000, & Author’s Estimates) (Preliminary) * Entered 1980 or later
Dispersal of Undocumented Population 2000 Composition Categories Highest % Undocumented (40-49% of foreign-born) (11) High % Undocumented (30-39%) (12) Lower % Undocumented (20-29%) (13) Lowest % Undocumented (<20%) (15)
Growth in Limited English Population Percent Growth in LEP, 1990-2000 100% Growth or More (15) 77-96% Growth or More (6) 31-65% (includes 6 Major Destinations) (16) <28% -- All Other States (14)
Limited English Proficient ImmigrantsPoorer on Average Los Angeles New York City Source: Urban Institute, Los Angeles-New York Immigrant Survey (LANYCIS).
Children of Immigrants (& LEP) Concentrated in Metro Areas Percent Non-Metropolitan Among Children 5-19 Enrolled in K-12, 2000 Children of Immigrants* Children of Natives* All Children Source: Urban Institute tabulations from C2SS PUMS. *Excludes Puerto Ricans.
Immigrant Students & English • Immigration & Language Trends -- Growth in Children of Immigrants -- Characteristics (Poverty) -- Geography & Grade Distribution • Students & Language -- Non-English Trends -- Problem Groups Late Entrants Long-Term LEPS • Linguistic Isolation -- Schools & Parents
Immigrant Children Are aRising Share of Students (1 in 5) Share of K-12 Enrollment All Children of Immigrants U.S.-Born Children of Immigrants Foreign-Born Children Source: Van Hook & Fix (2000); Urban Institute tabulations from C2SS PUMS. Excludes Puerto Ricans.
20% of School Kids AreChildren of Immigrants Source: Urban Institute tabulations. Includes Puerto Ricans.
Origins of Immigrant ChildrenShift Markedly by 2000 Proportion of K-12 Children of Immigrants (Including 1st & 2nd Generations) Source: Van Hook & Fix (2000); Urban Institute tabulations from C2SS PUMS. Excludes Puerto Ricans.
But Trend Reverses in Late ’90s Immigrant Children Increasingly Poor Percent of K-12 Students in Families Below 100% of Poverty African-American Foreign-Born Immigrants All Children of Immigrants White, not Hispanic Source: Van Hook & Fix (2000); Urban Institute tabulations from C2SS PUMS. Excludes Puerto Ricans.
Foreign-Born Children IncreaseFastest in Grades 6-12 Share of K-5 or 6-12 Enrollment Foreign-Born Children Recently-Arrived* Foreign-Born Children Source: Van Hook & Fix (2000); Urban Institute tabulations from C2SS PUMS. Excludes Puerto Ricans.
Spanish Increasingly Prevalent --Sharp Increases in 1990s Millions of Children (5-19) Speaking a Language Other than English At Home Spanish Other Non-English Language Asian Language Source: Van Hook & Fix (2000); Urban Institute tabulations from C2SS PUMS. Includes Puerto Ricans.
LEP Share Declines by Generation;Second Generation LEP Stays High Proportion of K-12 Students Not Speaking English “Very Well” (LEP) Source: Urban Institute tabulations from C2SS PUMS. Excludes Puerto Ricans.
More LEP Children are NativeThan Foreign-Born First Generation 900,000 35% Third+ Generations 500,000 19% Second Generation 1.2 Million 46% Source: Urban Institute tabulations from C2SS PUMS. Includes Puerto Ricans.
Most LEP Children In US for Many Years Grades K-5 Grades 6-12 Thousands of Children by Years Lived in U.S., 2000 Source: Urban Institute tabulations from C2SS PUMS. Includes Puerto Ricans.
LEP Students AttendLinguistically-Segregated Schools Percentage of LEP or Non-LEP Children Source: Urban Institute tabulations from Schools and Staffing Survey, 1999.
Hispanics & Asians more likely to bein Linguistically-Segregated Schools Proportion LEP in school of the “average” student by race or English ability Source: Urban Institute tabulations from Schools & Staffing Survey, 1999.
LEP Children May Not HaveParental English Resources Proportion of K-12 Students with No Parent Who Speaks English at Least “Very Well” Source: Urban Institute tabulations from C2SS PUMS. Includes Puerto Ricans.
Data for NCLB Grants to States • Census-ACS Data -- Uniformly Defined & Collected -- Based on Speaking Only -- Non-Professional (Parental) Assessment -- Sample-Based, possible Undercount • School-Based Data -- Standards & Collections Vary Within & Across Schools & States -- Based on “Whole Child” Approach -- Professional Assessment -- Administrative Counts (Complete) -- Interested Party Generates Data
School vs. Census Data • School Data finds More Kids -- 400K above Census 5-17 -- 400K higher in California • Regional Patterns -- Western States Higher -- Eastern States Lower • Funding Formula -- “Fixed Pie” Reduces Disparity -- California Gains -- New York Loses -- Percentage Changes Large
Ratio of State LEP to Census Ratio State LEP to Census LEP <67% (State is Low) (13) >200% (State is Hi) (6) 67-90% (11) 110-175% (11) 90-100% (5) 100-110% (5)
West Gains $ with School Data; East Gains from Census-ACS Change in Fund Allocation to States (in millions of dollars) Based on $300 Million Allocation using School-Defined LEP Population Versus 2000 Census-Defined LEP Aged 5-17 Years Only Changes of $1.5 Million or more are shown
For more information,contact: • Michael Fix • Jeffrey S. Passel • Immigration Studies Program • Population Studies Center • Urban Institute • 2100 M St., NW • Washington, DC 20037 mfix@ui.urban.org; (202) 261-5517 jpassel@ui.urban.org (202) 261-5678