Linear vs. Nonlinear Functions!
110 likes | 369 Views
Learn to distinguish between linear and nonlinear functions using graphs, equations, or tables. Discover how to determine linearity based on data points and identify various non-linear patterns. Gain insights through a helpful Graphic Organizer provided in the playlist.

Linear vs. Nonlinear Functions!
E N D
Presentation Transcript
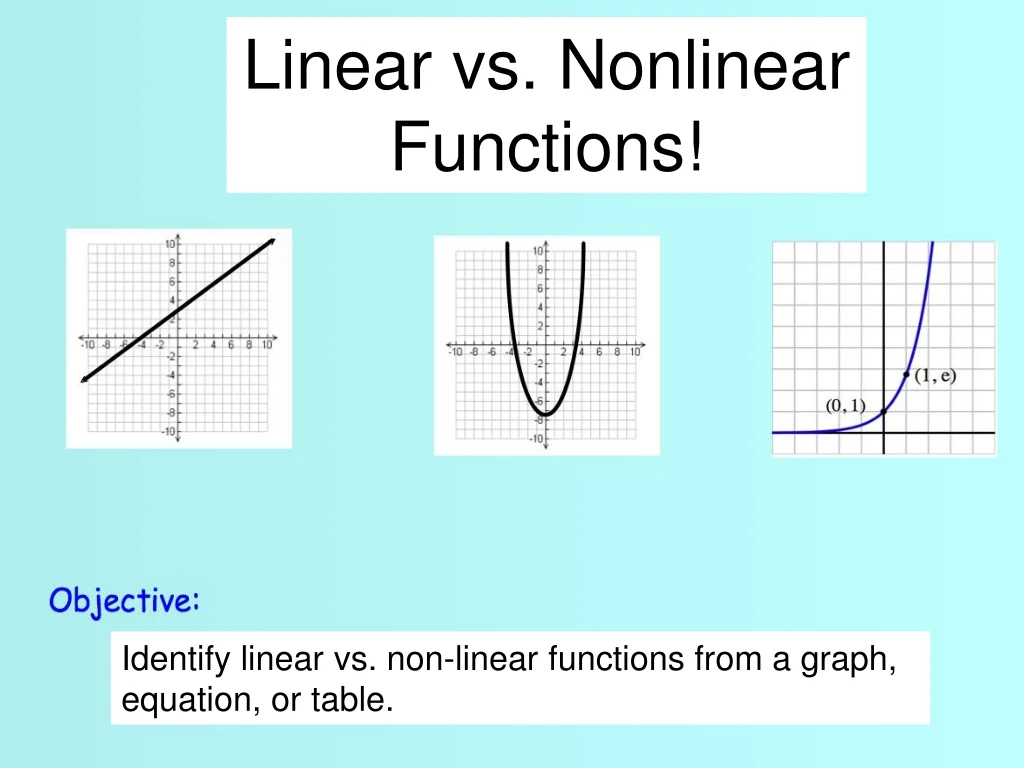
Linear vs. Nonlinear Functions! Identify linear vs. non-linear functions from a graph, equation, or table.
Take notes on this Graphic Organizer throughout the Playlist.
More Graphs Non-linear
How can I tell if a set of data points is linear or non-linear?
If the change in y divided by the change in x is constant, then the function is linear. Here, notice that the change in y is 3. The change in x is 1. So, the change in y divided by the change in x equals 3. This is a linear function.
If the change in y divided by the change in x is not constant, then the function is not linear.
Non-linear Non-linear Non-linear