Download
1 / 9
100 likes | 464 Views
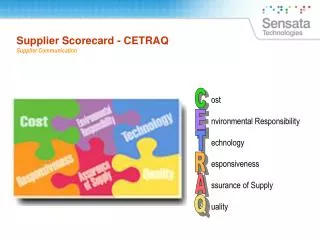
SCORECARD Supplier Assessment. Scorecard is an assessment of manufacturing suppliers provided by the Supply Quality on a monthly basis. It consists of six charts which show respectively: - Escapes - PPM - EPPM - OTD - SQP (Supplier Quality Performance) - SOR (Supplier Overall Rating).

E N D
Scorecard is an assessment of manufacturing suppliers provided by the Supply Quality on a monthly basis. It consists of six charts which show respectively:- Escapes- PPM- EPPM- OTD- SQP (Supplier Quality Performance) - SOR (Supplier Overall Rating) What is a Scorecard?
Individual charts – presentation It shows the number of escapes produced by the supplier during the current month. The number of escapes is a component of the supplier summary performance. It shows the number of deviated pieces declared per 1 million pieces supplied. PPM is a component of the supplier summary performance.
Individual charts – presentation continued It shows the number of non-declared deviated pieces (of escapes) per 1 million pieces supplied. ePPM is a component of the supplier summary performance. The chart called OTD (On-Time Delivery) as the name itself suggests shows OTD as percentage. OTD is a component of the supplier summary performance
Individual charts – presentation continued It shows relationship between ePPM and PPM. PPM and ePPM quantities in the chart of a specific month are average totals within the last 3 months. QP is calculated using the following formula: QP = 0.70 x R + 0.30 x A, where: R – proper weights - ePPM during last 3 months is the reference) A – proper weights - PPM during last 3 months is the reference)
Example of SQP calculation SQP = 0.70 x R + 0.30 x A Number of deviated pieces supplied in a month = 1000 pcs Number of deviated parts notified = 10 pcs Number of deviated parts not notified (escapes) = 3 pcs PPM = 10/1000*1000000 = 10 000 A = 69 ePPM = 3/1000*1000000 = 3 000 R = 80 SQP = 0.70 x 80 + 0.30 x 69 = 77Supplier at L3 level
Individual charts – presentation continued The chart called Supplier Overall Rating embraces OTD, Quality Performance and quality tools held by our supplier. The following forumla is used to calculate it: SOR = 90%x(OTDx0.3+QPx0.7) + points for quality tools (max. 10) Þ3 points for AS 9100, Þ4 points for DQCR, Þ3 points for MCS/LCS
Based on the quality assessment (SQP), the following levels are identified: Þ L1 – Supplier at Excellent level – does not require corrective actions to be developed or presented (90-100) Þ L2 – Supplier at Good level – corrective actions need to be developed and presented by the supplier (80-89) Þ L3 – Supplier at Acceptable level – supplier needs a lot of support from the customer through quality visits, training, audits or commonly developed corrective actions (50-79) Þ L4 – Supplier at Unacceptable level – a business decision whether to continue cooperation needs to be taken (0-50) • IMPORTANT! • Þ Scorecard is provided to the Supplier quarterly. • A monthly report is provided for L3 & L4 Suppliers, • Supply Quality Specialist analyzes causes of low level • Supplier is required to provide a corrective action plan. • Þ L3 or L4 Supplier is required to present and implement proper corrective actions. If Supplier remains at L4 more than 3 months, it may be removed from the list of approved suppliers.
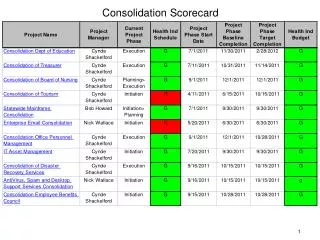
Example scorecard OTD GOLD (95%-100%) Quality L3 – Supplier at Acceptable level – Supplier needs a lot of support from the customer through quality visits, training, audits or commonly developed corrective actions (50-79)