Download
1 / 31
310 likes | 377 Views
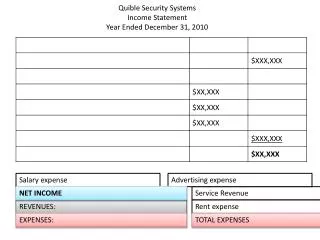
AUDITED GROUP INCOME STATEMENT FOR THE YEAR ENDED DECEMBER 31, 2013. 2. GROUP BALANCE SHEET TOTAL ASSETS AS AT DECEMBER 31, 2013– KSH M. Total 29,705. Total 26,953. GROUP BALANCE SHEET TOTAL LIABILITIES AS AT DECEMBER 31, 2013 – KSH M. Total 26,953. 5.

E N D
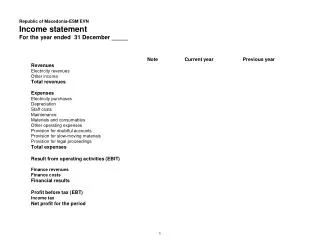
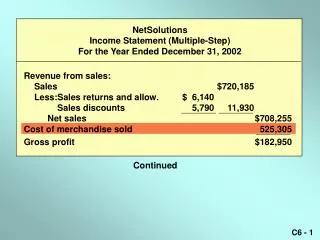
AUDITED GROUP INCOME STATEMENTFOR THE YEAR ENDED DECEMBER 31, 2013 2
GROUP BALANCE SHEET TOTAL ASSETS AS AT DECEMBER 31, 2013– KSH M Total 29,705 Total 26,953
GROUP BALANCE SHEET TOTAL LIABILITIES AS AT DECEMBER 31, 2013 – KSH M Total 26,953
5 GROUP CASH FLOW STATEMENT FOR THE PERIOD ENDED DECEMBER 31, 2013
6 GROUP CASH FLOW STATEMENT FOR THE PERIOD ENDED DECEMBER 31, 2013
7 HISTORICAL PERFORMANCE TURNOVERKESM GROUP TURNOVER Grows 24% over previous year Cement sales grows 31% Cement 86% of the total business CAGR 23% per year
8 HISTORICAL PERFORMANCE EBIDTA KES M EBIDTA EBITDA increased by 14% Combination of local and imported clinker Dar plant production is based on imported clinker CAGR 25% per year
9 HISTORICAL PERFORMANCE PROFIT BEFORE TAX KES M PROFIT BEFORE TAX Profit Before Tax has increased by 12%. CAGR 24% per year
10 HISTORICAL PERFORMANCE PROFIT AFTER TAX KES M PROFIT AFTER TAX Increases by 8% CAGR 24% per year
11 HISTORICAL PERFORMANCEEARNINGS & DIVIDENDS KES PER SHARE EPS AND DPS The rapid growth over the last Few Years Has Been Part Funded With Retained Earnings. Dividend Payout is 22% of Earnings and has increased by 20% in 2013. EPS
12 HISTORICAL PERFORMANCETOTAL ASSETS KES M INVESTING IN CEMENT CAPACITY Over the last 5 years ARM has invested In a 1,000,000 tons cement capacity in Kenya made up of an integrated clinker and cement capacity in Kaloleni and grinding capacity in Athi River. During 2011, ARM acquired a cement grinding plant with 100,000 tons capacity in Kigali, Rwanda. The Dar Cement plant with a capacity of 750,000 tons was commissioned in October 2012 and the 1,200,000 ton clinker plant in Tangawill be ready for commissioning in June 2014
13 HISTORICAL PERFORMANCE CREDIT RATING SHORT TERM A1 : Highest certainty of timely payments, liquidity factors are excellent and supported by good fundamental protection factors. Risk factors are minor. LONG TERM A : Good investment Grade, indicating high credit quality, good protection factors, risk factors are small and variable due to economic cycles
14 HISTORICAL PERFORMANCEMARKET CAP GROWTH MARKET CAP GROWTH Dec 2005 US$ 32 M 15TH NOV 2013 US$ 472M SHARE PRICE REFLECTS INCREASED INSTITUTIONAL INTEREST Increasing interest from institutional investors in the cement sector has enabled competitive industry benchmarked pricing Over 15% of the free float of 48% is held by institutional investors Whilst forward capacity utilization and earnings factored in the current price, new capacity of 1.5 m tpa under construction In Tanzania not reflected in share price In January 2013, The Company Shares were split 1 to 5 NSE.
KENYA CUMMULATIVE AFTER TAX CASH GENERATION KSH 9.15 BILLION 2004 TO 2013
KENYA CUMMULATIVE AFTER TAX CASH UTILIZATION KSH 9.15 BILLION 2004 TO 2013
CUMMULATIVE INVESTMENT IN TANZANIA CEMENT KSH 14.5 B 2008 TO 2013
18 GROUP NET DEBT KES M
24 EAST AFRICA AND REGIONAL MARKETS DEMAND NEW GRINDING CAPACITY LIKELY TO INCREASE FASTER THAN NEW CLINKER CAPACITY AND CATCHING UP WITH DEMAND @16% growth @12% growth @ 8% growth Actual demand 2013 9.9 million tons 5 Million Ton per year clinker deficit Installed and Projected New Capacity with Local Clinker
25 KENYA CLINKER CAPACITY SHORTFALL 2013 TOTAL CEMENT CONSUMPTION 4.5 mtpa TOTAL CAPACITY MET WITH LOCAL CLINKER 3.0 mtpa TOTAL CEMENT CONSUMPTION MET WITH IMPORTED CLINKER 1.5 mtpa
26 TANZANIA CLINKER CAPACITY SHORTFALL 2013 TOTAL CEMENT CONSUMPTION 3.5 mtpa TOTAL CAPACITY MET WITH LOCAL CLINKER 1.9 mtpa TOTAL CEMENT CONSUMPTION MET WITH IMPORTED CLINKER 1.6 mtpa
27 BUT IMPORTED CLINKER IS MORE EXPENSIVE 172 Actual Figures based to 100 100 Imported Clinker Cost 72 % Higher
STRATEGY 2015- 2020 STRATEGIC INTENT AND SHAREHOLDER VALUE PROPOSITION Make ARM Cement the largest cement manufacturer in the region with capacity doubling to 5 Million tons. Operate at internationally benchmarked efficiencies and maintain valuation of US $ 300 + per ton of installed annual cement capacity 29