Download
1 / 1
30 likes | 213 Views
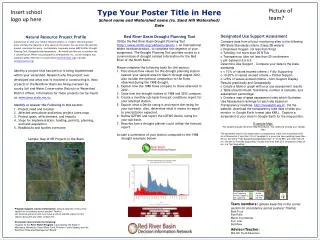
Picture of team?. Type Your Poster Title in Here School name and Watershed name ( ie . Sand Hill Watershed) Date. Insert school logo up here. Designated Use Support Assessment Compare data from all your monitoring sites to the following MN State Standards criteria (Class 2B waters):

E N D
Picture of team? Type Your Poster Title in HereSchool name and Watershed name (ie. Sand Hill Watershed) Date Insert school logo up here Designated Use Support Assessment Compare data from all your monitoring sites to the following MN State Standards criteria (Class 2B waters): o Dissolved Oxygen: not less than 5mg/l o Turbidity: not more than 25 NTUs o Transparency tube not less than 20 centimeters o pH: between 6.5-8.5 Determine Use Support - Compare your data to the state standards o < 10% of values exceed criteria = Fully Supporting o 10-25% of values exceed criteria = Partial Support o >25% of values exceed criteria = Non-Support Display Results graphically and Geospatially o Create a table or graph with your use assessment results o Table should include; Site Name, number of samples, and assessment percentage. o Create a map of your assessment sites which illustrates Use Assessment rankings for each site based on Transparency readings. http://riverwatch.wq.io/ Via the website, download the transparency tube data of sites you monitor in Google Earth format (aka KML). Capture a screenshot of your sites in Google Earth for the map portion. Example Map: This sample includes the entire Red River Basin. You need only include your sample sites. The parameter used in this assessment is transparency, which has a standard of 20 cm in Minnesota. If less than 10% of samples for a given site have readings lower than 20 cm, the site is “Fully Supporting Designated Use.” If 10-24.99% are lower than 20 cm , the site is “Partially Supporting.” If a site has more than 25% of samples under 20 cm, it is “Not Supporting.” Natural Resource Project Profile Introduction to what your natural resource project is. I expect that this project piece will take the majority of your space on the poster. You can move the sections around, rearrange the space – but maintain 3 separate pieces (NRP Profile; Drought Planning Tool; Designated Use Assessment) . We would also like you to maintain the 3 column layout. Where you put graphics, arrangement, etc. can be changed. Any questions please feel free to contact Asher (asher@iwinst.org) or Evelyn (evelyn@iwinst.org). Identify a project that has been or is being implemented within your watershed. Research why the project was developed and what was/is involved in constructing it. Most projects in the Red River Basin are being overseen by county Soil and Water Conservation Districts or Watershed District offices. Information for these projects can be found at: www.bwsr.state.mn.us. Identify or Answer the Following in this section Project need and location Affected area above and below project (area map) Project goals, effectiveness, and impacts Steps for implementation: funding, permits, planning, and land acquisition Roadblocks and hurdles overcome Sample: Map of NR Projects in the Basin Red River Basin Drought Planning Tool Utilize the Red River Basin Drought Planning Tool (http://www.rrbdin.org/subbasin-reports ), an International Water Institute product, to complete this segment of your assignment. The Drought Planning Tool provides access to a common base of drought related information for the Red River of the North Basin. Please complete the following tasks for this section: Plot stream flow values for the drought planning station nearest your sample area for March through August 2012. Also include the optional comparison to the flows observed during the 1988 drought. Explain how the 1988 flows compare to those observed in 2012. State how the drought indices of 1988 and 2012 compare. Create a monthly sub-basin forecast conditions report for your selected station. Explain what a Decile rating is and report the rating for your sub-basin. Also, determine what it means in regard to precipitation expected. Define UZTWC and report the UZTWC Decile rating for your sub-basin. Describe how a drought planner could utilize the forecast report. Include a screenshot of your station compared to the 1988 drought (example below) Designated Use Support (% Exceed) Fully supporting (0-9.99) Partially supporting (10-24.99) Not supporting (25-100) Team members: (please keep this in the corner section for consistency across posters! Thanks) Barb Trout Fish Riffle Macro Invertebrate D.O. Low Red River Advisor/Teacher: Mrs./Mr. Field Adventure Program Support, Contact information: (please keep this in the corner section for consistency across posters! Thanks) List financial sponsors and if you have a school website, place it in this section along with any other contact info. All schools must include the following: “Support for the River Watch Program is provided by the State of Minnesota, Minnesota Clean Water Fund, Pollution Control Agency and the Red River Watershed Management Board.”