Download
1 / 1
10 likes | 144 Views
Known Pollutants and Biological Indicators in the Dry Creek Watershed. Data Concerns Based on Regulator Standards. Definitions

E N D
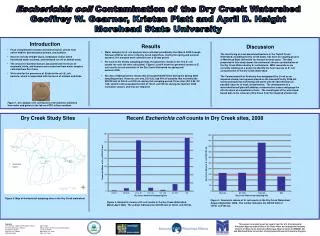
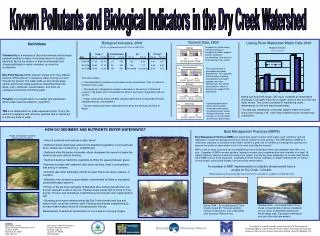
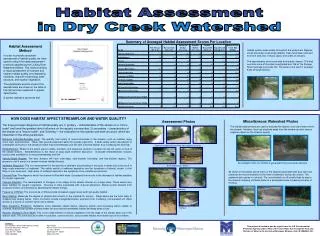
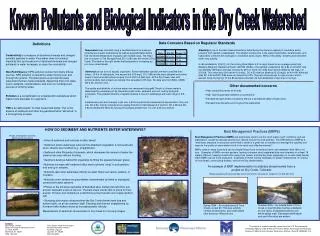
Known Pollutants and Biological Indicators in the Dry Creek Watershed Data Concerns Based on Regulator Standards Definitions Conductivity is a measure of dissolved minerals and charged pollutant particles in water. Pure water does not conduct electricity. But as the amount of dissolved minerals and charged pollutants in water increases, so does the conductivity. Non-Point Source (NPS) pollution comes from many diffuse sources. NPS pollution is caused by water moving over and through the ground. The water picks up and carries away natural and human-made pollutants, depositing them into lakes, rivers, wetlands, coastal waters, and even our underground sources of drinking water. Pollution is a contamination of a habitat with substances which make it less favorable for organisms. TSS is an abbreviation for total suspended solids. This is the amount of sediment and other tiny particles that is “stirred up” in a moving body of water. Temperature was recorded using a handheld device to measure instantaneous water temperature as well as programmable device that monitored temperature changes over multiple days. The major site of concern is Tile Storage Road (DC-0.28) near the mouth of Dry Creek. The table to the right shows that temperate is increasing as you move downstream. Alkalinity is one of the best measurements for determining the streams capacity to neutralize acidic pollution from rainfall or wastewater. The alkaline compounds in the water (carbonates, bicarbonates, and hydroxides) combine with hydrogen to neutralize acidic inputs. Without this ability, streams would become acidic very quickly. A natural alkalinity (CaCO3) for the Licking River Basin is 41.6 mg/L based on an average value from Western Allegheny Reference Reach (KDOW, 2009a). One sample, collected at DC-2.84 on 2/16/09, had low alkalinity (28 mg/L) and was reduced by 25% or more. DC-2.84 also had low alkalinity (32 mg/L) on 3/31/09. This value was 23% below 41.6 mg/L. DC-4.52 had low alkalinity (31.8 mg/L) on 4/14/09. Although sites DC-4.52 and DC-2.84 were not reduced by 25%, they are close enough to raise concern and to warrant more monitoring. Of the 85 samples collected, 24 had alkalinities of less than 41.6 mg/L. Ammonia can be toxic to aquatic organisms. Some freshwater species are more sensitive than others. Of the 14 data points, five exceed the 0.05 mg/L. DC-1.89 had the most elevated and varied levels of ammonia with values ranging from 0.002 to 2.062 mg/L. All the Dry Creek, sites with ammonia data, had at least one sample that exceeded 0.05 mg/L. No data exist for UNKA, UNKB, SB-0.35, and DC-4.52. The acidity and alkalinity of surface waters are measured using pH. The pH of stream water is determined by rainwater pH, by interactions with rocks, sediment and soil, and by biological processes. The greatest diversity of aquatic species is found in waterways with a pH range of 6.5 – 8.0. Instantaneous pH and changes in pH over a 24-hour period was measured at several sites. Only one site, DC-2.84, had an instantaneous reading that did not fall between 6.0 and 9.0. DC-0.28 and DC-2.84 exceeded the WQC by having pH changes greater than 1.0 over a 24-hour period. • Other documented concerns • High conductivity levels at all sites • High Total Suspended sediment concentrations • Elevated nitrogen levels at locations without a centralized sewer infrastructure • Elevated total phosphorus throughout the watershed HOW DO SEDIMENT AND NUTRIENTS ENTER WATERWAYS? Best Management Practices (BMPs) Photos showing bare land with obvious signs of erosion Photos showing mass wasting on the creek banks Best Management Practices (BMPs) are techniques used to control storm water runoff, sediment, and soil stabilization, as well as manage decisions to reduce nonpoint source pollution. The EPA defines a BMP as a "technique, measure or structural control that is used for a given set of conditions to manage the quantity and improve the quality of storm water runoff in the most cost-effective manner.“ BMPs come in many forms and can be simple things that a home/land owner can implement with little or no cost. Examples of BMPs are rain gardens, leaving a riparian zone (vegetated strip near streams) of at least 18 meters (59 feet), keeping construction away from creeks, and planting trees (especially on or near creek banks). Other BMPs can be more expensive. Examples of these include installation of sewer infrastructure, re-routing of round ways, constructing bridges, and contouring stream banks. • Influx of sediment and nutrients is often linked. • Sediment enters waterways when land is disturbed (vegetation is removed) and when streams are modified (e.g., straightened). • Sediment often fills parts of channels, which decreases the amount of water the channel can carry without flooding. • Sediment destroys habitat for organisms by filling the spaces between gravel. • Nutrients increase with sediment influx since nutrients “cling” to soil particles that end up in streams. • Nutrients also enter waterways directly as water flows over lawns, pasture, or cropland. • Nutrients enter streams as groundwater contaminated by failed or improperly constructed septic systems. • Photos to the left show examples of disturbed land. Gullies (top left) from soil erosion represent a loss of top soil. The bare slope (center left) is prone to more erosion. Erosion and slumping is undermining a tree that will soon topple (bottom left) • Slumping and erosion along sections the Dry Creek stream bank (top and bottom right), an all too common sight. Flooding and channel straightening by humans make matters worse by increasing water velocity. Measurement of sediment concentration in Dry Creek is in its early stages. An example of BMP implementation to stabilize stream banks from a project on Dry Creek, Colorado Project designed and constructed by Queen of the River Consultants, Longmont, CO 303-651-2514 Summer 2000 -- An outside bend of Trout Creek on beat #3 after machine installation of rock vanes, transplanted willows and willow/sedge mats. Decreased width/depth and pool/riffle ratios are evident. Spring 1999 -- An outside bend of Trout Creek on beat #3. This area exhibits vertical eroded banks, poor width/depth ratio and poor riffle/pool ratio. Contacts April Haight, Director Tessa Edelen, Watershed Program MSU Environmental Education Center Kentucky Waterways Alliance LC 101A, IRAPP 222 Bakery Square Morehead, KY 40351 Louisville, KY 40206 (606) 783-2455 (502) 589-8008 This project is funded in part by a grant from the U.S. EnvironmentalProtection Agency under 319(h) of the Clean Water Act through the KentuckyDivision of Water to the Kentucky Waterways Alliance (Grant # C9994861-04).