Download
1 / 14
480 likes | 1.68k Views
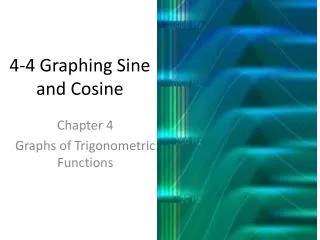
Graphing Sine and Cosine Functions. In this lesson you will learn to graph functions of the form y = a sin bx and y = a cos bx where a and b are positive constants and x is in radian measure. The graphs of all sine and cosine functions are related to the graphs of

E N D
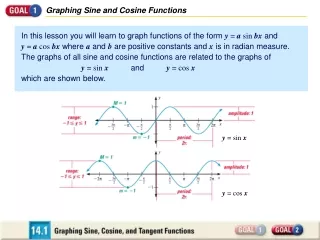
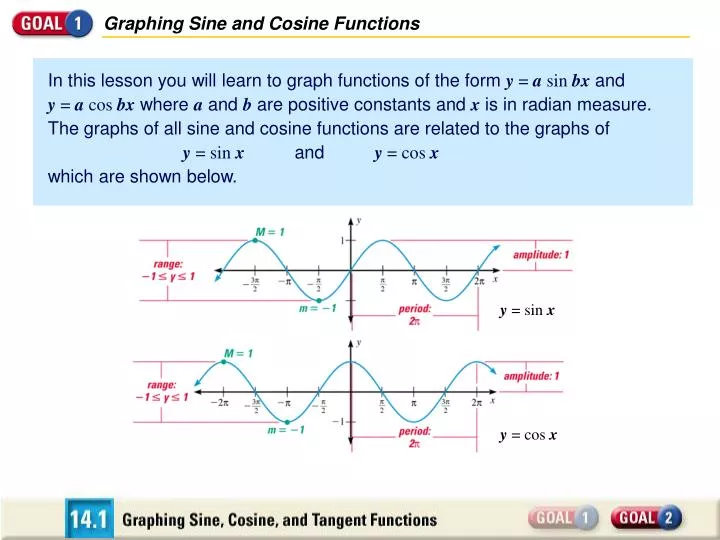
Graphing Sine and Cosine Functions In this lesson you will learn to graph functions of the form y= a sin bx and y = a cos bx where a and b are positive constants and x is in radian measure. The graphs of all sine and cosine functions are related to the graphs of y = sin x and y = cos x which are shown below. y = sin x y = cos x
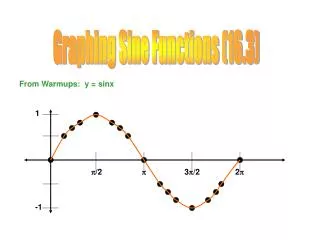
Graphing Sine and Cosine Functions π 2 The maximum value of y=sin x is M=1 and occurs when x=+2nπ where n is any integer. The maximum value of y= cosx is also M=1 and occurs when x=2nπ where n is any integer. The functions y = sin x and y = cos x have the following characteristics: The domain of each function is all real numbers. The range of each function is –1£y£1. Each function is periodic, which means that its graph has a repeating pattern that continues indefinitely. The shortest repeating portion is called a cycle. The horizontal length of each cycle is called the period. The graphs of y = sin x and y = cos xeach has a period of 2π.
Graphing Sine and Cosine Functions 1 2 3π 2 The minimum value of y =sin x is m=–1 and occurs when x=+2nπ where n is any integer. The minimum value of y =cosx is also m =–1 and occurs when x= (2n + 1)π where n is any integer. The amplitude of each function’s graph is (M – m) = 1. The functions y = sin x and y = cos x have the following characteristics:
Graphing Sine and Cosine Functions 2π |b| 2π 4 π 2 2π 2π 1 3 1 3 amplitude =|a| and period = The graph of y = 2 sin 4x has amplitude 2 and period = . The graph of y = cos 2πx has amplitude and period =1. CHARACTERISTICS OF Y = A SIN BX AND Y = A COS BX The amplitude and period of the graphs of y = a sin bx and y = a cos bx, where a and b are nonzero real numbers, are as follows: Examples
Graphing Sine and Cosine Functions 2π b 2π |b| amplitude =|a| and period = 2π 4 π 2 The graph of y = 2 sin 4x has amplitude 2 and period = . 2π 2π For a > 0 and b > 0, the graphs of y = a sin bx and y = a cos bx each have five key x-values on the interval 0 £x£ : the x-values at which the maximum and minimum values occur and thex-intercepts. CHARACTERISTICS OF Y = A SIN BX AND Y = A COS BX The amplitude and period of the graphs of y = a sin bx and y = a cos bx, where a and b are nonzero real numbers, are as follows: Examples 1 3 1 3 The graph of y = cos 2πx has amplitude and period =1.
Graphing Sine and Cosine Functions 2π 1 2π b The amplitude is a = 2 and the period is = =2π. The five key points are: Intercepts: (0, 0); (2π,0); = (π, 0) ( ) ( ) 2 , 2 Maximum: • 2, 2 = ( ) ( ) 3 2 3 4 , –2 • 2, –2 Minimum: = ( ) 1 4 1 2 • 2, 0 Graph the function. y = 2 sin x SOLUTION
Graphing Sine and Cosine Functions 2π b 2π 2 The amplitude is a = 1 and the period is = =π. The five key points are: ( ) ( ) ( ) ( ) 3 4 , 0 , 0 Intercepts: = ; = ( ) ( ) 2 , –1 • , –1 Minimum: = 3 4 1 2 1 4 • , 0 • , 0 4 Graph the function. y = cos 2x SOLUTION Maximums: (0, 1);(π, 1)
Graphing a Cosine Function 1 3 2π b 2π π 1 3 Graph y = cos πx. The amplitude is a = and the period is = =2. ( ) ( ) ( ) ( ) 1 2 3 2 1 4 3 4 • 2, 0 • 2, 0 Intercepts: = ; = , 0 , 0 ( ) ( ) 1 3 1 3 Maximum: ; 0, 2, ( ) ( ) 1 3 1 2 1 3 – – • 2, 1, Minimum: = SOLUTION The five key points are:
Graphing Sine and Cosine Functions The periodic nature of trigonometric functions is useful for modeling oscillating motions or repeating patterns that occur in real life. Some examples are sound waves, the motion of a pendulum or a spring, and seasons of the year. In such applications, the reciprocal of the period is called the frequency. The frequency gives the number of cycles per unit of time.
Modeling with a Sine Function 1 period b 2π Frequency = 440 = The pressure as a function of time is given by P = 5 sin 880πt. MUSIC When you strike a tuning fork, the vibrations cause changes in the pressure of the surrounding air. A middle-A tuning fork vibrates with frequency f=440 hertz (cycles per second). You would strike a middle-A tuning fork with a force that produces a maximum pressure of 5 pascals. Write a sine model that gives the pressure P as a function of time t (in seconds). Then graph the model. SOLUTION In the model P= a sin bt, the maximum pressure P is 5, so a=5. You can use the frequency to find the value of b. 880π = b
Modeling with a Sine Function 1 f 1 440 ( ) 1 440 1 440 • , 0 The amplitude is a = 5 and the period is = . Intercepts: (0, 0); ; = ( ) ( ) 1 440 1 4 1 1760 Maximum: = • , 5 , 5 3 4 1 2 ( ) ( ) 1 880 1 440 ( ) , 0 , 0 ( ) 3 1760 • , –5 Minimum: = ,–5 MUSIC When you strike a tuning fork, the vibrations cause changes in the pressure of the surrounding air. A middle-A tuning fork vibrates with frequency f =440 hertz (cycles per second). You would strike a middle-A tuning fork with a force that produces a maximum pressure of 5 pascals. Write a sine model that gives the pressure P as a function of time t (in seconds). Then graph the model. SOLUTION The five key points are:
Graphing Tangent Functions π 2 π2 The domain is all real numbers except odd multiples of . At odd multiples of , the graph has vertical asymptotes. π |b| The period is . nπ 3 π 3 π 2| b| There are vertical asymptotes at odd multiples of . Example The graph of y = 5 tan 3x has period and asymptotes at x = (2n + 1) = + where n is any integer. π 2(3) π 6 The graph of y = tan x has the following characteristics. The range is all real numbers. The graph has a period of π. CHARACTERISTICS OF Y = A TAN BX If a and b are nonzero real numbers, the graph of y= a tan bx has these characteristics:
Graphing Tangent Functions The graph of y = tan x has the following characteristics. The graph at the right shows five key x-values that can help you sketch the graph of y = tan x for a > 0 and b > 0. These are the x-intercept, the x-values where the asymptotes occur, and the x-values halfway between the x-intercept and the asymptotes. At each halfway point, the function’s value is either a or –a.
Graphing a Tangent Function π 4 1 2 π b π 4 3 2 Graph the function y = tan 4x. The period is = . π 8 x=• , orx = ; 1 2 π 4 π 8 x=–• , orx = – ( )( ); 1 4 π 4 3 2 π 16 3 2 , , • = ( )( ) 1 4 π 4 3 2 π 16 3 2 , , – • – = – – SOLUTION Intercept: (0, 0) Asymptotes: Halfway points: