Download
1 / 21
210 likes | 315 Views
This guide explores the fundamentals of exponential functions, focusing on exponential growth. It covers the definition of exponential functions, characteristics of exponential growth functions, and the concept of asymptotes. You will learn how to graph exponential functions, identify their equations, and understand their applications in real life, such as compound interest. Key terms like 'a', 'r', 't', 'A', 'P', 'n', and 't' are defined in context. With examples and step-by-step solutions, this resource is invaluable for mastering exponential growth concepts.

E N D
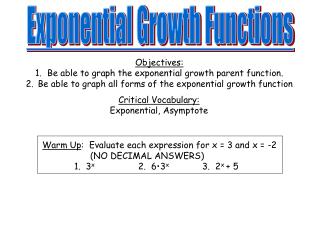
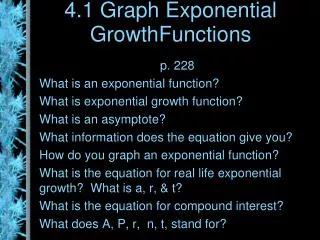
4.1 Graph Exponential GrowthFunctions p. 228 What is an exponential function? What is exponential growth function? What is an asymptote? What information does the equation give you? How do you graph an exponential function? What is the equation for real life exponential growth? What is a, r, & t? What is the equation for compound interest? What does A, P, r, n, t, stand for?
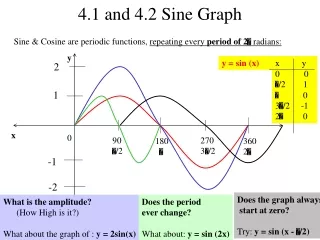
Exponential Function • f(x) = bx where the base b is a positive number other than one. • Graph f(x) = 2x • Note the end behavior • x→∞ f(x)→∞ • x→-∞ f(x)→0 • y=0 is an asymptote
Asymptote • A line that a graph approaches as you move away from the origin The graph gets closer and closer to the line y = 0 ……. But NEVER reaches it 2 raised to any power Will NEVER be zero!! y = 0
x 2 Graph y = . SOLUTION STEP 1 Make a table of values. STEP 2 Plot the points from the table. Draw, from left to right, a smooth curve that begins just above the x-axis, passes through the plotted points, and moves up to the right. STEP 3
This shows of y= a • 2x • Passes thru the point (0,a) (THE Y-INTERCEPT IS “a”) • The x-axis is the asymptote of the graph • D is all reals (the Domain) • R is y>0 if a>0 and y<0 if a<0 • (the Range)
These are true of: • y = abx • If a>0 & b>1 ……… • The function is an Exponential Growth Function • http://my.hrw.com/math06_07/nsmedia/tools/Graph_Calculator/graphCalc.html
D+ D= all reals R= all reals>0 y = 0 Always mark asymptote!!
x a.y = • 4 1 a. Plot ( 0, ½) and (1, 2) .Then, from left to right, draw a curve that begins just above the x-axis, passes through the two points, and moves up to the right. 2 Graph the function. SOLUTION
Example 1 y = 0 • Graph y = - (3/2)x • Plot (0, -1) and (1, -3/2) • Connect with a curve • Mark asymptote • D=?? • All reals • R=??? • All reals < 0
To graph a general Exponential Function: • y = a bx-h + k • Find your asymptote from k • Pick values for x. Try to make your exponent value 0 or 1. • Complete your T chart (Find y). • Sketch the graph.
Example 2 Graph y = 3·2x-1-4 • h = 1, k = −4 asymptote y = −4 Pick x values x y D= all reals R= all reals >-4 1 2 −1 2 y = -4
Now…you try one! • Graph y= 2·3x-2 +1 • State the Domain and Range! • D= all reals • R= all reals >1 y=1
In 1996, there were 2573 computer viruses and other computer security incidents. During the next 7 years, the number of incidents increased by about 92% each year. Computers • Write an exponential growth model giving the number n of incidents tyears after 1996. About how many incidents were there in 2003?
= 2573(1.92) t n = a (1 + r) t t = 2573(1 + 0.92) • Graph the model. • Use the graph to estimate the year when there were about 125,000 computer security incidents. SOLUTION STEP 1 The initial amount is a = 2573 and the percent increase is r =0.92. So, the exponential growth model is: Write exponential growth model. Substitute 2573 for aand 0.92 for r. Simplify.
Using this model, you can estimate the number of incidents in 2003 (t = 7) to be n = 2573(1.92) ≈247,485. 7 The graph passes through the points (0, 2573) and (1,4940.16). Plot a few other points. Then draw a smooth curve through the points. STEP 2
STEP 3 Using the graph, you can estimate that the number of incidents was about 125,000 during 2002 (t ≈ 6).
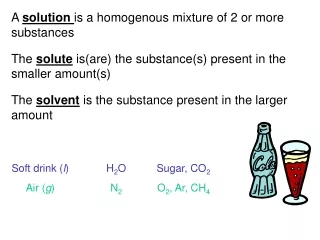
Compound Interest Compound interest is interest paid on the initial investment, called the principal and on previously earned interest. Interest paid only on the principal is called simple interest.
Compound Interest • A=P(1+r/n)nt • P - Initial principal • r – annual rate expressed as a decimal • n – compounded n times a year • t – number of years • A – amount in account after t years
Compound interest example • You deposit $1000 in an account that pays 8% annual interest. • Find the balance after I year if the interest is compounded with the given frequency. • a) annually b) quarterly c) daily A=1000(1+.08/4)4x1 =1000(1.02)4 ≈ $1082.43 A=1000(1+ .08/1)1x1 = 1000(1.08)1 ≈ $1080 A=1000(1+.08/365)365x1 ≈1000(1.000219)365 ≈ $1083.28
What is an exponential function? An equation with a variable as the exponent. • What is an exponential growth function? f(x) = abx when a > 0 and b > 1 • What is an asymptote? A line that a graph approaches as you move away from the origin. • What information does the equation give you? y = abx-h +k (k - asymptote.) • How do you graph an exponential function? Plot the asymptote, pick values for x to make exponent 0 or 1. • What is the equation for real life exponential growth? What is a, r, & t? y = a(1 + r)t a = initial amount, r = rate, t = time • What is the equation for compound interest? What does A, P, r, n, t, stand for? A = amount in account, P = principal, r = rate, n = # times compounded, t = # of years
4.1 Assignment Page 232, 4 – 30 even