Download
1 / 32
320 likes | 499 Views
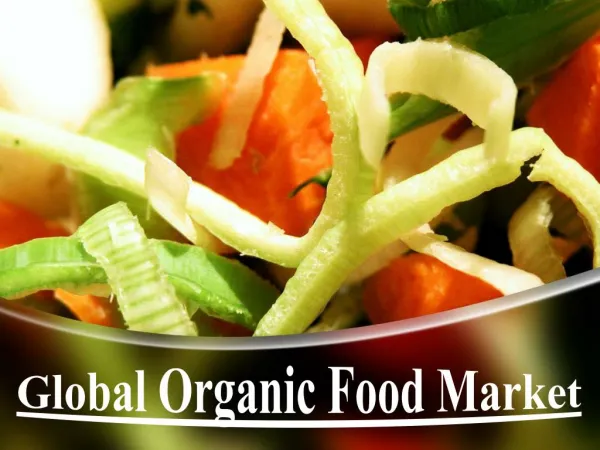
The Organic Market. Sarah Schumann. Outline. Global Markets Market Distribution Organic Food Categories Organic Non-Food Categories Consumers.

E N D
The Organic Market Sarah Schumann
Outline • Global Markets • Market Distribution • Organic Food Categories • Organic Non-Food Categories • Consumers
“Organic is a niche, but a very profitable niche. Give consumers what they truly want/need and they will dig deeply into their pockets. Organic dairy is mainstream. Two-thirds of the organic milk and cream is delivered to consumers via conventional supermarkets, not the ‘health food stores’ frequently associated with the organic of days gone by. . . Organic is here to stay, not a fad marching by in the night . . . Whether you opt in or not, it certainly is a category worth watching. It gives us one more window into the minds of consumers.” -Jerry Dryer, Consultant (Organic Trade Association, 2007)
Europe • Globally, it is the largest market for organic food and drink • Germany • UK • Italy and France • Central and Eastern Europe (Yussefi, 2006) http://vlib.iue.it/images/europe-map.jpg
North America • General: • Fastest growing market in the world • Overtake Europe • Demand high • Stock exchange • Large food companies “Every major food company now has an organic division. There's more capital going into organic agriculture than ever before.” -Michael Pollan • United States • Kare 11 news Extra • Canada http://www.politicalresources.net/north-america-map.gif
Asia • General: • Small market • Production increasing • Japan • China • South Korea, Taiwan, Singapore and Malaysia • India, Thailand and the Philippines (Yussefi, 2006) http://www.stanford.edu/class/humbio103/ParaSites2006/Sparganosis/Sparganosis%20Website/asia-map.gif
Oceania • Australia and New Zealand • Half of the global organic farmland (Australia) • Small market • Export-oriented production • Organic food processing is increasing http://www.ericandjoan.com/worldtrip/australia/map-aus.gif http://www.worldguides.com/images/auckland/new_zealand_map.jpg
Distribution of Organic Food in the United States • Becoming more common in retail stores • Independent natural food stores and chains – 47% • Whole Foods Market • Wild Oats grocery retailers • Mass market – 46% Supermarkets/grocery stores • Mass merchandisers • Club store • Farmer’s markets, food service and non-retail-store – 7% • Based on 2005 organic sales in the U.S. (Organic Trade Association, 2006) http://www.gpsinformation.org/jack/photo-test/pics/kroger-fruit-2.jpg
Organic Food CategoriesUnited States • 2.5% of the total U.S. food sales in 2005 (MDA, 2007) • 8 categories Fruit/Vegetable Beverages Snack Foods Bread/Grains Prepared Foods Dairy Sauce/Condiments Meat/Fish/Poultry • Total organic food sales in 2005 - 13.8 billion (OTA, 2006) • Largest category • Fastest growing category • Growth rates 15%-21% since 1997 (OTA, 2006)
Growth of Consumer Sales Millions of Dollars (Organic Trade Association, 2006)
Food Categories Compared (Organic Trade Association, 2006)
Growth of Food Categories Percent (Organic Trade Association, 2006)
Growth v. Share Percent (Organic Trade Association, 2006)
Growth Projection (Organic Trade Association, 2006)
Organic Non-Food Categories • 0.22% of the total non-food sales in 2005 (MDA, 2007) • Six categories Organic Supplements Organic Personal Care Organic HH Products/Cleaners Organic Pet Food Organic Flowers Organic Fiber • Total sales of $744 million in 2005 (OTA, 2006) • Largest categories • Fastest growing categories • Emerging market
Non Food Categories Compared (Organic Trade Association, 2006)
Organic Consumer Segments • 39% of U.S. consumers use organic products to some degree (OTA, 2007) • People living in the western US purchase more organic food that in other areas of the US (Zepeda, Chang & Reid, 2006) • Three Segments • Organic Integrated Group • Organic Middle Group • Organic Fringe Group (Organic Trade Association, 2007)
Demographic Influence on Purchasing Organics • Conflicting data • Gender, age and having a degree do not seem to have a large impact on purchasing decisions • More likely to shop organically if: • Smaller and higher income household • Concerned about the environment • Have knowledge about alternative agriculture • Concerned about food safety • Enjoy trying new products • Households with children under age 18 (Dimitri & Greene, 2002)
Demographic Influence on Purchasing Organics • A group study was done to look at the differences between Caucasians and African Americans when it comes to motivations, beliefs, knowledge and behaviors of organic foods. • Conducted in Madison Wisconsin in 2002-2003 and consisted of 43 participants • The study consisted of four groups • Respondents most important characteristics of organics: • Taste (26 or 43 participants) • Price • Not as important African Americans • Origin of food • More important to Caucasian shoppers • African Americans were not as familiar with organic foods • African Americans more accepting of price premiums • African Americans more receptive and positive towards organic foods (Zepeda, Chang & Reid, 2006)
Motivations for Purchasing Organic Food • Health and Nutrition • Taste • Environment • Availability Based on a consumer survey done by the Hartman Group in 2000 (Dimitri & Greene, 2002)
Motivations for Purchasing Organic Food • Direct of indirect • Direct effect on consumer • Health • Taste • Freshness • Indirect effect on consumer • Environment • Animal welfare • People who are most likely to purchase organic foods feel there are both direct and indirect benefits (Zepeda, Chang & Reid, 2006)
What are They Willing to Pay? • An online poll of 1,000 households was conducted in 2002 • 20% of respondents were willing to pay 20 percent more for organic food • 67% said that price was keeping them from purchasing organic food http://www.whirlitzer.org/images/instore.jpg (Organic Trade Association, 2007)
Consumer Challenges for Growth of the Organic Market • Half of consumers do not know the true meaning of organic • Survey of 850 organic shoppers about the organic seal • ~50% thought it meant 100% organic • ~25% thought it meant 95% organic • ~16% thought it meant 75% organic • ~12% thought it meant some organic • (Rehan, 2007) • Low recognition of perceived benefits of organic products • Taste • Nutritional benefits • Others • High price • Satisfaction with conventional food • Limited availability (Organic Trade Association, 2007) http://transitionculture.org/wp-content/uploads/superm arket_01.jpg
Conclusions • Raise awareness for what organic means • Increase supply by increasing organic producers • Price
Outline • Global Markets • Market Distribution • Organic Food Categories • Organic Non-Food Categories • Consumers
References Dimitri, C. & Greene, C. (2002). Recent Growth Patterns in the U.S. Organic Foods Market. Washington D.C.: U. S. Department of Agriculture. Minnesota Department of Agriculture. (2007). The Status of Organic Agriculture in In Minnesota: A Report to the Legislature. Organic Trade Association. (2007). Industry Statistics and Projected Growth. October 19, 2007, from http://www.ota.com/organic/mt/business.html Organic Trade Association. (2006). The Organic Trade Association’s 2006 Manufacturer Survey U.S. Organic Industry Overview. Organic Trade Association, Greenfield MA. From http://www.ota.com/pics/documents/short_percent20overview_percent20MMS.pdf Rehan, K. (2007, Sept.). Feeding the Organic Demand. Candy Industry, pp. 50-52. Yussefi, W. (2006). The World of Organic Agriculture: Statistics & Emerging Trends2006. Switzerland: International Federation of Organic Agriculture Movements. Zepeda, L., Chang, H. & Leviten-Reid, C. (2006, Oct. 23). Organic Food Demand: A focus group study involving Caucasian and African-American shoppers. Agriculture and Human Values, pp. 385-394.