Download
1 / 45
450 likes | 584 Views
Basic Instrumentation Joachim Mueller. Principles of Fluorescence Spectroscopy Genova, Italy June 19-22, 2006. Figure and slide acknowledgements: Theodore Hazlett. ISS PC1 (ISS Inc., Champaign, IL, USA). Fluorolog-3 (Jobin Yvon Inc, Edison, NJ, USA ).

E N D
Basic Instrumentation Joachim Mueller Principles of Fluorescence Spectroscopy Genova, Italy June 19-22, 2006 Figure and slide acknowledgements: Theodore Hazlett
ISS PC1 (ISS Inc., Champaign, IL, USA) Fluorolog-3 (Jobin Yvon Inc, Edison, NJ, USA ) QuantaMaster (OBB Sales, London, Ontario N6E 2S8)
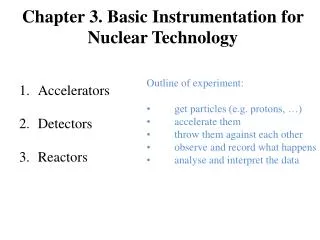
Fluorometer Components Excitation Polarizer Sample Emission Polarizer Excitation Wavelength Selection Light Source Emission Wavelength Selection Computer Detector Fluorometer: The Basics Note: Both polarizers can be removed from the optical beam path
Fluorometer Components Light Source Detectors Wavelength Selection Polarizers
The Laboratory Fluorometer Pex Pem Pem Standard Light Source: Xenon Arc Lamp Exit Slit ISS (Champaign, IL, USA) PC1 Fluorometer
Xenon Arc Lamp Profiles Lamp Light Sources Ozone Free • Xenon Arc Lamp (wide range of wavelengths) • High Pressure Mercury Lamps (High Intensities but concentrated in specific lines) • Mercury-Xenon Arc Lamp (greater intensities in the UV) • Tungsten-Halogen Lamps • Light emitting diodes (LEDs) Multiple color LEDs can be bunched to provide a broad emission range) Visible UV Mercury-Xenon Arc Lamp Profile
Light Emitting Diodes (LED) Wavelengths from 350 nm to 1300 nm Near UV LED
528nm 532nm 543nm 514nm 633nm 442nm 325nm 488nm 351 nm 364 nm 295nm 576nm Lasers Light Sources Titanium:Sapphire 690 nm – 990 nm 200 300 400 500 600 700 Wavelength (nm) Green He-Ne 10 mW Orange He-Ne 10 mW Argon-ion 100 mW Helium-cadmium Nd-YAG He-Ne >10 mW
Detectors Scallop Scallop Eyes From http://www.eyedesignbook.com/index.html Image courtesy of BioMEDIA ASSOCIATES http://www.ebiomedia.com
MCP & Electronics (ISS Inc. Champaign, IL USA) APD The silicon avalanche photodiode (Si APD) has a fast time response and high sensitivity in the near infrared region. APDs can be purchased from Hamamatsu with active areas from 0.2 mm to 5.0 mm in diameter and low dark currents (selectable). Photo courtesy of Hamamatsu
The Classic PMT Design Vacuum Dynodes Photocathode e- e- l e- e- e- e- Anode e- e- e- e- e- e- e- Window Constant Voltage (use of a Zenor Diode) Current Output resister series (voltage divider) Ground capacitor series (current source) High Voltage Supply (-1000 to -2000 V)
Hamamatsu R928 PMT Family R2949 Window with Photocathode Beneath
PMT Quantum Efficiencies Cathode Material Window Material
PMT PMT Computer Photon Counting (Digital) and Analog Detection time Signal Continuous Current Measurement Analog: Photon Counting: Variable Voltage Supply Constant High Voltage Supply Anode Current = Pulse averaging level Discriminator Sets Level TTL Output (1 photon = 1 pulse) • Primary Advantage: • Broad dynamic range • Adjustable range • Primary Advantages: • Sensitivity (high signal/noise) • Increased measurement stability
Wavelength Selection Fixed Optical Filters Tunable Optical Filters Monochromators
Optical Filter Channel Pex Pem Pem
Hoya O54 Long Pass Optical Filters Transmission (%) Spectral Shape Thickness Physical Shape Fluorescence (!?) Wavelength (nm)
More Optical Filter Types… Interference Filters (Chroma Technologies) Broad Bandpass Filter (Hoya U330) Transmission (%) Wavelength (nm) Neutral Density (Coherent Lasers)
Tunable Optical Filters Liquid Crystal Filters: An electrically controlled liquid crystal elements to select a specific visible wavelength of light for transmission through the filter at the exclusion of all others. AO Tunable Filters: The AOTF range of acousto-optic devices are solid state optical filters. The wavelength of the diffracted light is selected according to the frequency of the RF drive signal. Isomet (http://www.isomet.com/index.html)
Monochromators Mirrors Czerny-Turnerdesign • Slit Width (mm) is the dimension of the slits. • Bandpass is the FWHM of the selected wavelength. • The dispersion is the factor to convert slit width to bandpass. Exit Slit Entrance slit Rotating Diffraction Grating (Planar or Concaved)
The Inside of a Monochromator Mirrors Grating Nth Order (spectral distribution) Zero Order (acts like a mirror)
Changing the Bandpass • Drop in intensity • Narrowing of the spectral selection Fixed Excitation Bandpass = 4.25 nm Changing the Emission Bandpass 17 nm 17 nm Fluorescence (au) 8.5 nm 8.5 nm 4.25 nm 2.125 nm 4.25 nm 2.125 nm Wavelength (nm) Wavelength (nm) Collected on a SPEX Fluoromax - 2
Higher Order Light Diffraction Emission Scan: Excitation 300 nm Glycogen in PBS 2nd Order Scatter (600 nm) Excitation (Rayleigh) Scatter (300 nm) Fluorescence (au) 2nd Order RAMAN (668 nm) Water RAMAN (334 nm) Wavelength (nm) Fluorescent Contaminants
Monochromator Polarization Bias Parallel Emission Tungsten Lamp Profile Collected on an SLM Fluorometer Wood’s Anomaly No Polarizer Fluorescence Fluorescence Perpendicular Emission 800 250 250 800 Adapted from Jameson, D.M., Instrumental Refinements in Fluorescence Spectroscopy: Applications to Protein Systems., in Biochemistry, Champaign-Urbana, University of Illinois, 1978.
Correction of Emission Spectra B C ISSPC1 Correction Factors Wavelength ANS Emission Spectrum, no polarizer ANS Emission Spectrum, parallel polarizer corrected Fluorescence Fluorescence uncorrected Wavelength Wavelength from Jameson et. Al., Methods in Enzymology, 360:1
Excitation Correction Quantum Counter Exit Slit Pex Pem Pem
The Instrument Quantum Counter Common Quantum Counters (optimal range)* Rhodamine B (220 - 600 nm) Fluorescein (240 - 400 nm) Quinine Sulfate (220 - 340 nm) Optical Filter Quantum Counter Reference Detector 1.2 0.8 Eppley Thermopile/ QC Linearity of Rhodamine as a quantum counter 0.4 Fluorescence Here we want the inner filter effect! 0.0 400 200 600 Wavelength (nm) * Melhuish (1962) J. Opt. Soc. Amer. 52:1256
Excitation Correction Absorption (dotted line) and Excitation Spectra (solid line) of ANS in Ethanol Uncorrected Ratio Corrected Fluorescence Fluorescence Wavelength Wavelength Lamp Corrected Fluorescence Wavelength from Jameson et. Al., Methods in Enzymology, 360:1
Polarizers The Glan Taylor prism polarizer Two Calcite Prisms 0 90 Common Types: Glan Taylor (air gap) Glan Thompson Sheet Polarizers 0 90 Two UV selected calcite prisms are assembled with an intervening air space. The calcite prism is birefringent and cut so that only one polarization component continues straight through the prisms. The spectral range of this polarizer is from 250 to 2300 nm. At 250 nm there is approximately 50% transmittance.
Sample Issues Signal Attenuation of the Excitation Light PMT Saturation Excess Emission Fluorescence vs Signal Instrument Signal LINEAR REGION Wavelength (nm) [Fluorophore] • Reduced emission intensity • ND Filters • Narrow slit widths • Move off absorbance peak
Attenuation of the Excitation Light through Absorbance Sample concentration & the inner filter effect Rhodamine B from Jameson et. al., Methods in Enzymology (2002), 360:1
The second half of the inner filter effect: attenuation of the emission signal. Diluted Sample Wavelength (nm) Wavelength (nm) • Spectral Shift • Change in Spectral Shape Absorbance Spectrum
How do we handle highly absorbing solutions? Quartz/Optical Glass/Plastic Cells Excitation Emission Path Length 4 Position Turret SPEX Fluoromax-2, Jobin-Yvon Emission Detector Excitation Path Length
Front Face Detection Detector Thin Cells & Special Compartments Triangular Cells IBH, Glasgow G3 8JUUnited Kingdom Excitation Excitation Mirror Emission Sample [1] Absorbance Measurements Reflected Excitation & Emission [1] Adapted from Gryczynski, Lubkowski, & Bucci Methods of Enz. 278: 538
Light Sources for Decay Acquisition: Frequency and Time Domain Measurements Pulsed Light Sources (frequency & pulse widths) Mode-Locked Lasers ND:YAG (76 MHz) (150 ps) Pumped Dye Lasers (4 MHz Cavity Dumped, 10-15 ps) Ti:Sapphire lasers (80 MHz, 150 fs) Mode-locked Argon Ion lasers Directly Modulated Light Sources Diode Lasers (short pulses in ps range, & can be modulated by synthesizer) LEDs (directly modulated via synthesizer, 1 ns, 20 MHz) Flash Lamps Thyratron-gated nanosecond flash lamp(PTI), 25 KHz, 1.6 ns Coaxial nanosecond flashlamp (IBH), 10Hz-100kHz, 0.6 ns
Modulation of CW Light Use of a Pockel’s Cell Pulsed Emission Polished on a side exit plane 0 Pockel’s Cell Polarizer Mirror 90 Polarizer CW Light Source Radio Frequency Input The Pockel’s Cell is an electro-optic device that uses the birefringment properties of calcite crystals to alter the beam path of polarized light. In applying power, the index of refraction is changed and the beam exiting the side emission port (0 polarized) is enhanced or attenuated. In applying RF the output becomes modulated. Double Pass Pockel’s Cell
PMT Time Correlated Single Photon Counting Sample Compartment Pulsed Light Source Timing Electronics or 2nd PMT Filter or Monochromator Neutral density (reduce to one photon/pulse) Photon Counting PMT Constant Fraction Discriminator TAC Time-to-Amplitude Converter (TAC) Multichannel Analyzer Instrument Considerations Excitation pulse width Excitation pulse frequency Timing accuracy Detector response time (PMTs 0.2-0.9 ns; MCP 0.15 to 0.03 ns) Counts Time
Histograms built one photon count at a time … Fluorescence Decay Instrument Response Function Fluorescence Channels (50 ps) • The pulse width and instrument response times determine the time resolution. • The pulse frequency also influences the time window. An 80 MHz pulse frequency (Ti:Sapphire laser) would deliver a pulse every 12.5 ns and the pulses would interfere with photons arriving later than the 12.5 ns time.
[1] = I0 + I90 [2] = I0 + I90 [3] = I0 + I90 [4] = I0 + I90 [5] = 2 x I90 [6] = 2 x I90 Total = 4 x I0 + 8 x I90 Polarization Correction There is still a polarization problem in the geometry of our excitation and collection (even without a monochromator)!! Will the corrections never end ??? An intuitive argument: [4] [6] 0 [1] Polarized Excitation [3] The total Intensity is proportional to: I0 + 2 x I90 [5] 0 [2] 90 Setting the excitation angle to 0 and the emission polarizer to 54.7 the proper weighting of the vectors is achieved.* *Spencer & Weber (1970) J. Chem Phys. 52:1654
PMT PMT Frequency Domain Fluorometry Pockel’s Cell Sample Compartment CW Light Source Filter or Monochromator Analog PMTs(can also be done with photon counting) RF Turret Reference RF Signal Synthesizers S1 and S2 Signal Digital Acquisition Electronics S2 S1 Locking Signal S1 = n MHz S2 = n MHz + 800 Hz Similar instrument considerations as With TCSPC Computer Driven Controls
& hiding under the table: Frequency Synthesizers RF Amplifiers