Download
1 / 27
270 likes | 344 Views
Warming climate and changes in Alaska’s temperate rainforest: combining predictive modeling with monitoring. Tara M. Barrett 1 ,Greg Latta 2 , Paul E. Hennon 3 , Bianca N.I. Eskelson 2 , Hailemariam Temesgen 2. 1 Unaffiliated 2 Oregon State University

E N D
Warming climate and changes in Alaska’s temperate rainforest: combining predictive modeling with monitoring Tara M. Barrett1 ,Greg Latta2, Paul E. Hennon3, Bianca N.I. Eskelson2, Hailemariam Temesgen2 1 Unaffiliated 2 Oregon State University 3 Pacific Northwest Research Station
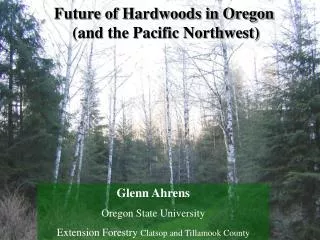
Distribution of western hemlock trees (Tsugaheterophylla) Western hemlock, along with other temperate rainforest tree species (Sitka spruce, western red cedar, yellow cedar) reaches its northern limit in the Gulf of Alaska region.
Bole deformation Brooms (branch deformation) Hemlock dwarf mistletoe (Arceuthobiumtsugensesubsp.tsugense) is a small plant that parasitizes western hemlock (Tsugaheterophylla) trees. Chlorosis
Both western hemlock and western hemlock dwarf mistletoe distributions are at the northern part of their geographic range in Alaska Map by Dustin Wittwer
Population size of host (Tsugaheterophylla) and parasite (Arceuthobiumtsugense subsp. tsugense) by elevation
Map from SNAP modeling group, Univ. of Alaska Fairbanks (www.snap.uaf.edu) Projections are for further increases in temperature over the next half century
Climate envelope models • Distribution is limited by a climate envelope outside of which a species cannot survive • For prediction, assumes distribution across climate-space remains the same, but spatial distribution shifts as climate changes • empirical – not process based • habitat only, does not predict actual presence • many different approaches: • GAM, neural nets, customized models • logistic modeling • Most Similar Neighbors imputation • Random Forest imputation
Prediction modeling for hemlock dwarf mistletoe and western hemlock Methods Reviewed literature for climate-related mechanisms that might explain mistletoe distributions and abundance. Created climate variables that corresponded to possible explanatory mechanisms. Tested predictive models against field data. Predicted future distribution
Reviewed previous research: • Extreme minimum winter temperatures reduce seed viability. • Snow reduces seed establishment and germination. • Rain reduces seed establishment and germination? • Spring frosts damage pollen viability • Fall frosts damage fruit • Life cycle takes longer to complete in Alaska (e.g., 12 yrs) than British Columbia (e.g. 5yrs) • Transplanted to 120 m higher elevation, fruits never matured Western dwarf mistletoe seed and holdfast
Predictive Variables Used Growing season variables: GDD (growing degree days above 0 C) RADIANS (modeled solar radiation) Low winter temperatures MINTEMP (min of mean min monthly temp) MINTEMPSD (standard deviation of mean min temps) Precipitation SNOW (modeled precipitation as snow) RAIN (mean annual precipitation - SNOW) Autumn freezes MINFALLTEMP (mean min Sept. temp) Spring freezes MINSPRINGTEMP (mean min April temp) Other SLOPE ET (modeled evapotranspiration) CMI (modeled precip – evapotranspiration)
Used 1961-1990 PRISM climate data from Oregon State Univ.: a spatial model of climate normals (monthly temperature and precipitation) to develop climate variables 8 Mean annual temperature (C) -12 PRISM data was 2 km resolution, so rescaled using 2 dimensional linear interpolation for precipitation and geographically weighted regression for temperature
All three methods (Random Forests, Most Similar Neighbors, and Logistic modeling) did fairly well at predicting the current range of hemlock and mistletoe
Methods Reviewed literature for climate-related mechanisms that might explain mistletoe distributions and abundance. Created climate variables that corresponded to possible explanatory mechanisms. Tested predictive models against field data. Predict future distribution
Future Climate Models • We used downscaled GCM composites created by the Scenarios Network for Alaska Planning (SNAP 2011). The composite models were made from • the MPI ECHAM5, • the GFDL CM2.1, • the 324 MIROC 3.2 (medres), • the UKMO HADCM3, and the • CCCmaCGCM3.1 models • which had been chosen based on relatively good performance in a review of GCMs for Alaska and Greenland by Walsh et al. (2008). • PRISM + (GCM_future – GCM_present) = Predicted • Scenarios Network for Alaska Planning [SNAP]. 2011. Alaska climate datasets online. Available from www.snap.uaf.edu/downloads/alaska-climate-datasets • Walsh, J.E., Chapman, W.L., Romanovsky, V., Christensen, J.H., and Stendel, M. 2008. Global climate model performance over Alaska and Greenland. J. Clim. 21:6156-6171.
Prediction for 2100 western hemlock habitat as a percent of present (=100), bias adjusted Scenario
Prediction for 2100 dwarf mistletoe habitat as a percent of present (=100), bias adjusted Scenario
BUT … • Habitat is not presence • Trees migrateslowly • eg, Sitka spruce on Kodiak island, roughly 1 mile per century (per Griggs, 1930s) • Dwarf mistletoe is dioecious; seeds can only travel (beyond a few dozen meters) with the help of birds or mammals
BUT … Western red cedar Yellow cedar
Numbers in parenthesis indicate number of forested plots with this species present Forested lands, excludes National Forest wilderness and Glacier Bay NP, only trees >= 5” d.b.h.
Summary • Plot level imputation is promising for climate/host/parasite mapping as it can be used for (1) range mapping (2) area affected estimates and (3) impact estimates • For this case study: Both Most Similar Neighbors and Random Forest do poorly at predicting presence/absence of western hemlock dwarf mistletoe at the plot level. • Most Similar Neighbors does moderately well at predicting abundance and distribution. • Random Forests does well at predicting distribution, but tends to underestimate abundance
Summary • For future predictions: • Climate Envelope Models may be most useful for • discussing why we think they are wrong • formulating hypotheses to test • Long-term monitoring using stable protocols really needs to accompany predictive modeling
For more information: • Barrett, T.M.; Latta, G.; Hennon, P.E.; Eskelson, B.N.I.; Temesgen, H. 2012. Host-parasite distributions under changing climate: Tsugaheterophylla and Arceuthobiumtsugense in Alaska. Canadian Journal of Forest Research 42:4:642-656 • Barrett, T.M. 2011. Change in forests between 1995-2003 and 2004-2008.In Forest Service Pacific Northwest Research Station General Technical Report PNW-GTR-835.