Elementary Probability Theory
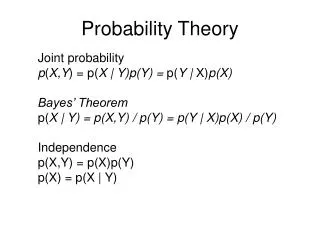
Chapter 4. Elementary Probability Theory. Understandable Statistics Ninth Edition By Brase and Brase Prepared by Yixun Shi Bloomsburg University of Pennsylvania. Probability. Probability is a numerical measure that indicates the likelihood of an event.

Elementary Probability Theory
E N D
Presentation Transcript
Chapter 4 Elementary Probability Theory Understandable Statistics Ninth Edition By Brase and Brase Prepared by Yixun Shi Bloomsburg University of Pennsylvania
Probability Probability is a numerical measure that indicates the likelihood of an event. All probabilities are between 0 and 1, inclusive. A probability of 0 means the event is impossible. A probability of 1 means the event is certain to occur. Events with probabilities near 1 are likely to occur.
Probability Events can be named with capital letters:A, B, C… P(A) means the probability of A occurring. P(A) is read “P of A” 0 ≤ P(A) ≤ 1
Probability Assignment Assignment by intuition – based on intuition, experience, or judgment. Assignment by relative frequency – P(A) = Relative Frequency = Assignment for equally likely outcomes
Law of Large Numbers In the long run, as the sample size increases, the relative frequency will get closer and closer to the theoretical probability. Example: We repeat the penny experiment, and the relative frequency gets closer and closer to P(head) = 0.50
Probability Definitions Statistical Experiment: Any random activity that results in a definite outcome. Event: A collection of one or more outcomes in a statistical experiment. Simple Event: An event that consists of exactly one outcome in a statistical experiment. Sample Space: The set of all simple events.
The Sum Rule and The Complement Rule The sum of the probabilities of all the simple events in the sample space must equal 1. The complement of event A is the event that Adoes not occur, denoted by Ac P(Ac) = 1 – P(A)
Probability versus Statistics Probability is the field of study that makes statements about what will occur when a sample is drawn from a known population. Statistics is the field of study that describes how samples are to be obtained and how inferences are to be made about unknown populations.
Independent Events Two events are independent if the occurrence or nonoccurrence of one event does not change the probability of the other event.
Multiplication Rule for Independent Events General Multiplication Rule – For all events (independent or not): Conditional Probability (when ):
Mutually Exclusive Events Two events are mutually exclusive if they cannot occur at the same time. Mutually Exclusive = Disjoint If A and B are mutually exclusive, then P(A and B) = 0
Addition Rules If A and B are mutually exclusive, then P(A or B) = P(A) + P(B). If A and B are not mutually exclusive, then P(A or B) = P(A) + P(B) – P(A and B).
Critical Thinking Pay attention to translating events described by common English phrases into events described using and, or, complement, or given. Rules and definitions of probabilities have extensive applications in everyday lives.
Multiplication Rule for Counting This rule extends to outcomes involving three, four, or more series of events.
Tree Diagrams Displays the outcomes of an experiment consisting of a sequence of activities. The total number of branches equals the total number of outcomes. Each unique outcome is represented by following a branch from start to finish.
Tree Diagrams with Probability We can also label each branch of the tree with its respective probability. To obtain the probability of the events, we can multiply the probabilities as we work down a particular branch.
Suppose there are five balls in an urn. Three are red and two are blue. We will select a ball, note the color, and, without replacing the first ball, select a second ball. Urn Example There are four possible outcomes: Red, Red Red, Blue Blue, Red Blue, Blue We can find the probabilities of the outcomes by using the multiplication rule for dependent events.
Factorials For counting numbers 1, 2, 3, … ! is read “factorial” So for example, 5! is read “five factorial” n! = n * (n-1) * (n-2) * … * 3 * 2 * 1 So for example, 5! = 5 * 4 * 3 * 2 * 1 = 120 1! = 1 0! = 1
Permutations Permutation: ordered grouping of objects. Counting Rule for Permutations
Combinations A combination is a grouping that pays no attention to order. Counting Rule for Combinations