Download
1 / 7
70 likes | 179 Views
RIPARIAN ET CONTRIBUTIONS TO LOW FLOW CONDITIONS. April 2013 COHYST Workshop. Simulation Issues . The models do not include recent driest years. The Platte at Grand Island is dry at times during 2002-2005. The surface water model has low flow in the 2002-2005 period but is never dry.

E N D
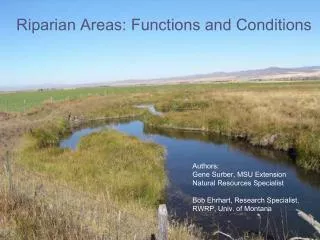
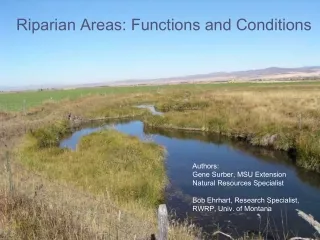
RIPARIAN ET CONTRIBUTIONS TO LOW FLOW CONDITIONS April 2013 COHYST Workshop
Simulation Issues • The models do not include recent driest years. • The Platte at Grand Island is dry at times during 2002-2005. • The surface water model has low flow in the 2002-2005 period but is never dry. • The ground water model is always wet at Grand Island. • The data shows losses from Odessa to Grand Island while the ground water model shows gains.
Looking for causes • A survey of the groundwater model for causes of the stream flow problem found contributing factors in the simulation of riparian ET. • ET surface elevations set at or near the highest elevations in a cell and ET extinction depths can be above much of land surface. • ET is not simulated in cells with stream boundaries, where much of the riparian wetlands are located.
Toward a solution • Tested a simple ET representation to see if the ET simulation might be a factor • Set ET surface at the average ground level • Set ET extinction depth constant at 8 feet below ET surface • Set the maximum ET rate to the pond evaporation rates times an adjustment value (67%) • Subtracted 12 inches/year for the ET rate that might be simulation in the watershed model • Multiplied the rate by the proportion of each model cell where the land cover (NLCD, 2001) was open water, riparian forest or emergent wetlands.
A result: Odessa – Grand Island Original Model Modified Model
Comparisons • The modified model simulated CPNRD’s 1997 average ET rate at 26.6 inches/year on 126,000 acres of riparian forest, wetlands and open water (assuming 12 inches year simulated by the watershed model). • CPNRD 1997 riparian forest ET 172,000 acre-feet over 76,225 acres for an average rate of 27.1 inches/year (Woodward). • Landon et al (2009) reported an ET rate of 21.7 inches/year in riparian forest at a site near Odessa