Download
1 / 20
200 likes | 412 Views
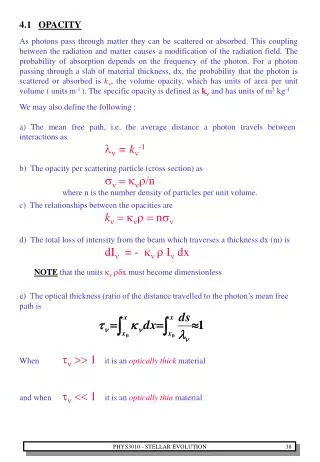
Lines as Continuous Opacity. Collaborators: D. J. Bord (Umich, Dearborn) Glenn Wahlgren, (Lund) Thanks to many others for advice. Main questions:. 1. Computational practicalities: ODF, OS, “individualized abundances. 2. Unclassified lines and their relation to photoionization “resonances.”.

E N D
Lines as Continuous Opacity Collaborators: D. J. Bord (Umich, Dearborn) Glenn Wahlgren, (Lund) Thanks to many others for advice.
Main questions: 1. Computational practicalities: ODF, OS, “individualized abundances. 2. Unclassified lines and their relation to photoionization “resonances.” 3. Relation to standard continuous opacity sources. Relative importance of weak and strong lines. 4. Harmonic vs. straight means.
General Remark: There are no universal answers. All questions depend on parameter space-- a. What is the wavelength interval? b. What are the abundances? c. What are the physical conditions (T, P, xt)? d. How will integration through an atmosphere affect answers to the above questions?
1. Computational Practicalities Current procedure is an in vitro approach, the physical conditions are fixed. Some modification for production is surely in order (cf. Piskunov&Kupka ApJ, 547 (2001) Calculations based primarily on Kurucz CDRoms 20, 21, 22. Therefore Ca-Ni. Some REE III to be noted later. Pull off all lines of first through third spectra within 20A intervals at selected wavelengths. Reformat data; use very nearly input to standard Michigan synthesis codes. Line lists are typically 20-40,000 lines.
Read into code that contains abundances, ionization potentials, partition functions, so that for each line, the relevant number density (cm-3) can be calculated. Arrange filter so that in addition to using all lines, one may exclude: a. classified lines (levels found in laboratory). b. unclassified lines c. lines with upper levels below first ionization limit (take only lines subject to autoionization)
Calculate the line opacity as if it were a synthesis. Main difference in this and synthesis code is there is only one set of physical conditions—no integration through atmosphere. Arbitrary abundances are possible. Get ODF’s. We use 1024 points at 0.02A spacings. Divide into 8 bins of 128 points. ODF’s are much like histograms, except that one first does an intensity sort before binning. The straight mean of the opacity for the 1024 points is by definition the same as the straight mean of the opacity in the 8 bins.
From the point of view of radiative transfer, the harmonic mean is the more physical quantity, since the radiation will escape through the transparent windows. The harmonic mean for the 1024 points is not the same as the harmonic mean of the 8 bins. The harmonic mean of the bins is typically some five per cent larger than the harmonic mean of the 1024 points.
2. Unclassified Lines and Relation to Photoionization Resonances (TopBase). Transitions to levels subject to autoionization will in principle have counterparts in photoionization cross sections. In practice, this is only approximately true because of incompleteness in both sets of calculations. At the moment, Kurucz has more realistic sets of states than TopBase, but no specific treatment of interaction with continuum states.
If one calculates ODF’s including lines subject to autoionization and later includes TopBase continuous opacities, some transitions are going to be counted twice! This may be only a difficulty in principle, as the opacity from the transitions in question is typically a small fraction of the total.
T=6000, Log(Pg) = 5.0, Solar Abundances Line Opacity: All CDRom 20, 21, 22 Lines: straight Tot Continuous Lines: harmonic Contributions from individual metals all below here
What is the relative importance of weak and strong lines? T = 6000K, Log(Pg) = 5.0, Solar Abundances 3800A All 27627 lines 702 Classified Lines Straight mean 1.94 E-06 1.92 E-06 Harmonic mean 1.94 E-08 1.07 E-08 Virtually all of the line opacity comes from the strong lines, but the weaker lines are significant for the transparency (Rosseland or harmonic mean). Standard opacity sources: (Mostly H-minus) 7.1E-08 4.6E-11 1.9E-10 Fe I (Atlas7) MgI (Atlas7)
How is it for SMR Star? Again, T = 6000K, Log(Pg) = 5 This time Z = 10 – 28 10 x Solar Solar: Using all 27627 lines Straight mean of lines: 3.45E-5 Harmonic mean: 3.65E-7 Harmonic of 8 bins 3.84E-7 Total Continuous: 2.71E-7 1.94E-6 1.94E-8 2.04E-8 7.10E-8 Now, using 10 x Solar, but only unclassified lines (26925) Straight mean of lines: 9.17E-7 Harmonic mean: 1.57E-7 Harmonic of 8 bins 1.62E-7
Note that the unclassified lines make a significant contribution relative to the standard continuous opacity sources. ----------------------------------------------------------- Among the unclassified lines, some will be strong, and recognized as lines in the stellar spectrum, but will not be synthesized. These lines will not be a part of the quasi-continuum, the weak-line haze that cannot be distinguished from continuous absorption. Some fraction of the unclassified lines should be added to the continuous absorption.
We don’t yet know what fraction of the line opacity to add to the continuous opacity when doing spectral synthesis. In solar work, we have augmented standard opacity sources until the calculated specific intensity matches that observed. In the UV, say 3600A, that can mean multiplying the known continuous opacity by 1.6 or so! If we don’t match the observed intensity, we aren’t doing a calculation for the real sun!!
Next: We do a numerical experiment designed to see the effect of line opacity on a cool Ap or CP star. In particular, we are interested in knowing what the effects of lines from the third spectra of the REE might contribute. We have calculated lines of Nd III and Sm III, and included a few additional lines from the DREAM site. What we found is that even with the REE overabundant by a factor of 1000, the lines from the third spectra do not seriously compete with standard opacity sources or lines from the iron group.
T = 8000K Log(Pg) = 4.0, 3600A 10 x Z=22-28 1000 x Z> 57 Solar 10 x Z=22-28 5.71E-08 1.05E-09 1.10E-09 Straight Mean Harmonic Harmonic bins 5.70E-07 1.00E-08 1.05E-08 5.74E-07 1.06E-08 1.12E-08 Standard continuous opacity: 1.78E-07 Mostly b-f of neutral hydrogen
Finally, let’s look at an iron-peak poor case: T = 8000 Log(Pg) = 4.0 Iron Group x 0.1, Lanthanides x 1000 Straight mean: 1.06 E-08 Harmonic mean: 1.80 E-10 Harmonic bins: 1.90 E-10 Standard Cont: 1.78 E-07 Conclusions: It does not seem likely that line opacity from the third spectra of the REE competes significantly with standard continuous opacity sources for most Ap-Cp abundances.
Epilog: Opacity Sampling (OS) For our 1024-point regions, we have not had much success with opacity sampling. Perhaps it is just our limited experience. Random sampling 256 points can give a result in error by a factor of two. Table gives ratio of sample to average of all 1024 points. Since sample is random, 1024 points do not give exact result. Sample/No points Mrich Solar84 • 2.14 0.256 • 0.666 2.22 • 1.11 1.25 • 1024 1.20 0.965
Thank You Thank You Thank You The End