Download
1 / 23
230 likes | 316 Views
Dive into linear equations exploring rates of change, graphing equations, and identifying constant or variable changes. Examples and application in skiing and cost analysis. Improve your algebra skills today!

E N D
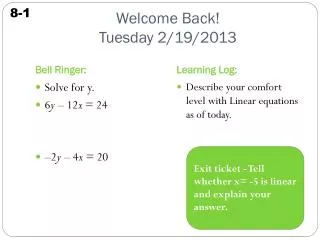
Welcome Back!Tuesday 2/19/2013 Bell Ringer: Learning Log: Solve for y. 6y – 12x = 24 –2y – 4x = 20 Describe your comfort level with Linear equations as of today. Exit ticket - Tell whether x= -5 is linear and explain your answer.
Write it down Vocabulary linear equation - is an equation whose solutions fall on a line rate of change - is a ratio that compares the amount of change in a dependent variable to the amount of change in an independent variable.
A linear equation is an equation whose solutions fall on a line on the coordinate plane. All solutions of a particular linear equation fall on the line, and all the points on the line are solutions of the equation.
If an equation is linear, a constant change in the x-value corresponds to a constant change in the y-value. The graph shows an example where each time the x-value increases by 3, the y-value increases by 2.
Additional Example 1A: Graphing Equations Graph the equation and tell whether it is linear. y = 3x – 1 +1 +1 +1 Make a table of ordered pairs. Find the differences between consecutive data points. +3 +3 +3 Write down the 4 sets of ordered pairs.
Additional Example 1A Continued The equation y = 3x – 1 is a linear equation because it is the graph of a straight line and each time x increases by +1 unit, y increases by +3 units. Plot the points on the graph!
Caution! Be careful when graphing each ordered pair. Double check each point you plot.
Additional Example 1B: Graphing Equations Graph the equation and tell whether it is linear. y = 2 Write the ordered pairs listed in the table on your notes. The equation y = 2 is a linear equation because it is the graph of the horizontal line where every y-coordinate is 2.
Check It Out: Example 1A Graph each equation and tell whether it is linear. y = 2x + 1 We’re working this one together. linear What is the constant x increase? What is the constant y increase?
Check It Out: Example 1A Continued Graph the points.
On your own Check It Out: Example 1B Graph each equation and tell whether it is linear. y = x2 + 1 non linear
Check It Out: Example 1B Continued Graph the points.
A rate of change is a ratio that compares the amount of change in a dependent variable to the amount of change in an independent variable. change in dependent variable rate of change = change in independent variable The rates for a set of data may vary, or they may be constant.
2 1 4 2 4 2 6 3 = 2 = 2 = 2 = 2 Additional Example 2A: Identifying Constant and Variable Rates of Change in Data Determine whether the rates of change are constant or variable. +1 +2 +3 +2 Find the difference between consecutive data points. +2 +4 +4 +6 Find each ratio of change in y to change in x. The rates of change are constant.
2 2 4 1 0 2 3 3 = 1 = 4 = 0 = 1 Additional Example 2B: Identifying Constant and Variable Rates of Change in Data Determine whether the rates of change are constant or variable. +2 +2 +3 +1 Find the difference between consecutive data points. +2 +4 +0 +3 Find each ratio of change in y to change in x. The rates of change are variable.
Check It Out: Example 2A Determine whether the rates of change are constant or variable. The rates of change are constant.
Check It Out: Example 2B Determine whether the rates of change are constant or variable. The rates of change are variable.
Additional Example 3: Sports Application A lift on a ski slope rises according to the equation a = 130t + 6250, where a is the altitude in feet and t is the number of minutes that a skier has been on the lift. Five friends are on the lift. What is the altitude of each person if they have been on the ski lift for the times listed in the table? Draw a graph that represents the relationship between the time on the lift and the altitude.
Additional Example 3 Continued Write the name next to the corresponding time in the table.
Additional Example 3 Continued Graph The altitudes are: Anna, 6770 feet; Tracy, 6640 feet; Kwani, 6510 feet; Tony, 6445 feet; George, 6380 feet. This is a linear equation because when t increases by 1 unit, a increases by 130 units. Note that a skier with 0 time on the lift implies that the bottom of the lift is at an altitude of 6250 feet.
Check It Out: Example 3 A home improvement store charges a base fee of $150 , plus $25 for each hour of machinery rental. The cost C for h hours is given by C = 25h + 150. Find the cost for 1, 2, 3, 4, and 5 hours. Is this a linear equation? Draw a graph that represents the relationship between the cost and the number of hours of rental. 1 hr = $175, 2 hr = $200, 3 hr = $225 4 hr = $250, 5 hr = $275; linear