Download
1 / 29
290 likes | 310 Views
A progress report on the development of the Shelf to Shoreline Observatory in Southern California, including the implementation of various monitoring tools and data integration.

E N D
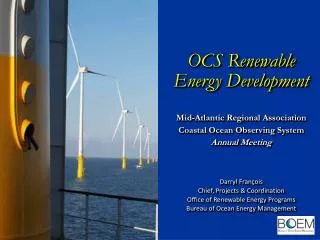
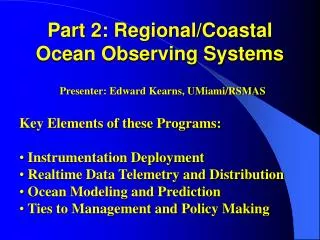
Southern California Coastal Ocean Observing System SCCOOS 2009 Regional Coordination Workshop Seattle, WA August 25, 2009
Part 1: Project Status ReportShelf to Shoreline Observatory Development DevelopmentProject Investigators:Julie Thomas and Eric TerrillProject Duration: July 1, 2008 – June 30, 2010 (2 years; currently in year 2)
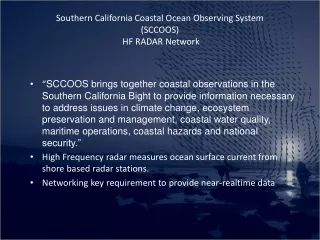
Project Status Report • Project Schedule and Milestones – RA Planning Grant and RCOOS: • Continued operation of nearshore egg and larval surveys that complement the offshore CALCOFI survey • Initiated weekly Harmful Algal Bloom (HAB) shoreline surveillance at five pier sites along the coast of Southern California • Development of nearshore climatologies and climate relevant indices relevant to ecosystem assessment for fisheries, IEAs, and MPA development • Operations and maintenance of the 1km resolution, realtime ocean model nowcast/forecast system (ROMS) • Maintained climate-relevant glider lines • Established interactive displays of data and products via SCCOOS web site • SCCOOS installed six new HF radar sites and at Trinidad, Pillar Point Air Force Station, Sausalito-Marin City Sanitary District, Point Mugu, San Mateo Point, and Camp Pendleton. • Trajectory tool set for HF radar based upon optimal mapping techniques
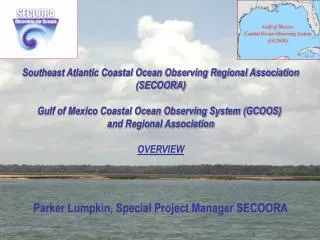
Project Status Report Significant Accomplishments: • Initiated and maintained Harmful Algal Bloom (HAB) surveillance program with delivery of timely and relevant data products, including the launch of a new website: www.sccoos.org/data/habs • Early detection and notification of a toxic HAB event in the San Pedro Channel using gliders, pier monitoring, and boat sampling • Marine Operations web page for delivery of aggregated waves, winds, ocean current information in geospacial format. In-person training workshops this Fall. • Maintained limited climate observation network within SCCOOS including a nearshore CALCOFI stations to complement routine offshore observations, three offshore glider lines that observe ocean climate including El Niño detection, operation of the ocean modeling system, and the synthesis of a decades worth of discharger CTD stations with offshore CALCOFI stations • Continued management of realtime data through www.sccoos.org
Keys to Success and Potential Challenges • Ecosystem Health & Climate Trends • What worked well? • CalCOFI surveys collected zooplankton biomass, fish and invertebrate larvae and conducted underway measurements of temperature, salinity, irradiance and fluorescence. • Extending the historically offshore stations of CalCOFI closer to the coast brought relevance to the National Pollutant Discharge Elimination System (NPDES) permit discharge monitoring sites and to California’s Marine Protected Areas planning process. • Forecasts and nowcasts of ocean conditions on a range of space and time scales were made using the Regional Ocean Modeling System (ROMS).The models make estimates of connectivity on bight-wide scales as a guide to understanding dispersal of materials near and below the sea surface. ROMS with observed winds were also used to estimate larval dispersion. • A multi-year model reanalysis is being conducted to assist in the development of dynamical indices that have ecosystem relevance. • Describe potential and/or real challenges : • Data integration and distribution for large and complex datasets such as CalCOFI • Validating model output, and assessing model. R&D to define products. • Integrating biological datasets with physical data sets and representing those syntheses • Continuous funding for sustaining glider lines • Determining, and development of, sensors to add to the standard suite (T, S, velocity, Chl a) to address ecosystem issues
Keys to Success and Potential Challenges • Water Quality • What worked well? • The SCCOOS HAB team has been monitoring algal species at fives sites from San Luis Obispo to San Diego for the past year – using traditional (water samples) and technological capabilities (AUVs) to provide as complete a picture as possible. • A website has been established that provides for automatic data submission and up-to-date reporting of the HAB conditions at each of the five sites. • The group provided early detection and alerted the community to the onset of the HAB event (Pseudo-nitzschia). • The SCCOOS HAB team is a highly collaborative group, and is engaged with HAB monitoring efforts for the entire state (collaborations with CeNCOOS investigators). • During the Hyperion Treatment Plant 1-mile diversion, SCCOOS provided a set of resources including a web site that consolidated observations for rapid access and evaluation by managers and regulators during the discharge diversion. • Describe potential and/or real challenges : • Development of technological capability for in situ and/or remote sensing of HAB species and events that enables the use of autonomous vehicles, moorings, and remote sensing for early detection and warning. 6
HAB SURVEILLANCE PROGRAM HAB Product – various delivery methods (web, email)
Keys to Success and Potential Challenges • Marine Safety and Maritime Operations • What worked well? • A customized interactive website for the Ports of Los Angeles and Long Beach Harbor that provides timely and accurate information about marine conditions to ensure the safe passage of vessels and efficient harbor navigation, including automated messages on wave conditions. • A partnership with NAVAIR and the U.S. Navy for operational access to the Naval Research Laboratory’s Coupled Ocean/Atmosphere Mesoscale Prediction System (COAMPS) to provide 48 hour wind and precipitation forecasts on the SCCOOS website. • After an oil spill in the Santa Barbara Channel, California's Office of Spill Prevention and Response (OSPR) contacted SCCOOS to provide surface current data that was integrated into GIS-based support products and provided to first responders. • Participation in Area Committee Meetings to present SCCOOS products for use in oil spill preparation and drills – and continue work to integrate HF radar into the OSPR GIS and NOAA GNOME model and the usage of real-time waves, winds, currents, AIS, chart overlays, etc. • Supported the National Preparedness For Response Exercise Program (NPREP), an industry-led oil spill response exercise off the coast of San Diego, with surface current measurements and particle tracking. • Describe potential and/or real challenges : • Ensuring the information is out to users in the field, training, stakeholder involvement 8
Left – OSPR generated Surface current map for the command post during the 2008 NPREP exercise • In response to Cosco Busan, a tailored GIS format of HF radar data is now available to OSPR staff and has been in use in drills (Safe Seas, NPREP) and in recent responses in the Santa Barbara Channel. • NOAA HAZMAT now can access surface currents via a national standard NETCDF format (chain of command for enviro data – USCG to NOAA)
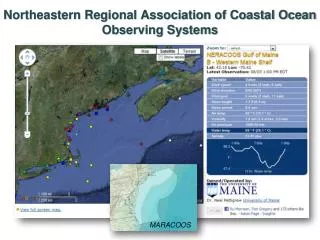
Surface current maps available with SOCAL Platform locations http://www.sccoos.org/data/hfrnet/
LA/LB Customized Web Interface NOAA charts integrated with Model Output Prediction Points at key transfer locations Overlay for Shipping Lanes, Swell Model, and Surface Currents
Web-based display of realtime AIS data with available NOAA Charts
Current Status: Products Directions: Place an “x” in boxes that best describe the kinds of products being developed for the focus areas. See RA Presentation guidelines for terms *near real-time data (>24 hours)
Current Status: Products Directions: Place an “x” in boxes that best describe the kinds of products being developed for the focus areas. See RA Presentation guidelines for terms *near real-time data (>24 hours)
Current Status: Product Examples • Provide access to near real time data for harmful algal blooms to avoid risks to public health, marine life, the environment, and the economy: www.sccoos.org/data/habs • Provide an interactive website for ports and harbors with information on marine conditions that is critical to the safe passage of vessels and efficient harbor navigation: www.sccoos.org/data/harbors/lalb • Provide HF radar derived surface current maps to assess and mitigate impacts of impaired water quality, track oil spills, assist with search and rescue efforts and monitor the physical environment to better understand ecosystem change: http://www.sccoos.org/data/hfrnet/ • Provide intuitive, interactive multi-dimensional display of model output: http://www.sccoos.org/data/roms/
Current Status: Observations Indicate the # of observations in each category. Color code: X# if funded exclusively by NOAA IOOS funds; X if combination of NOAA IOOS funds and other; X is non-NOAA IOOS funds Observation = parameter = (temperature, salinity, chlorophyll, etc… X station)/sampling period. These numbers indicate the observations collected during one sampling period. For example, there are ~23,184 meteorological observations collected per hour = 14 parameters X 1,656 stations. *Not represented – models 16
Observation Types Physical - water temperature, sea level, salt, beam c, waves, backscatter, transmissivity, normalized water-leaving radiance, total suspended matter, secchi, absorption Meteorological - air temperature, wind speed, wind direction, precipitation, pressure, relative humidity, visibility, infrared, water vapor Chemical - O2, ph, ammonia, nitrate, phosphate, silicate, nitrite, radioactive tracer Biological - chlorophyll, e. coli, enterococus, fecal coliforms, total coliforms, phytoplankton, phaeophytin, productivity Geological - 17
Current Status: Modeling and DMAC subsystems * See guidelines for definitions **Regionwide = entire RA
Meteorology Stations Too many dots to represent…
Part 2: Looking Forward: Future Plans Assuming $5 million of funding per year, please indicate what your future plans are for your RA. The $5 million should cover activities currently funded by the RA Planning Grants and the RCOOS.
Future Plans: Observations Future plans are focused on product development and data management with an emphasis on integrating physical and biological data.
Future Plan: Modeling and DMAC * See Guidelines for definitions ** Region-wide means entire RA
Funding Scenario Briefly describe the major CUTS to the subsystem under the reduced funding scenarios