Download
1 / 44
440 likes | 582 Views
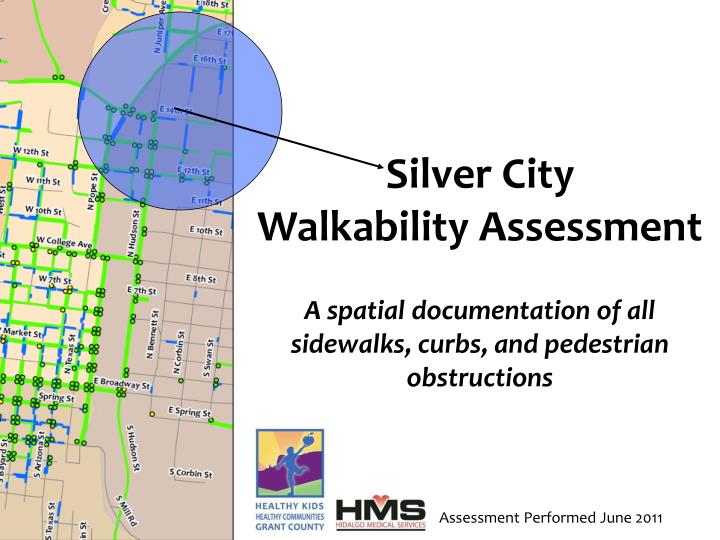
Silver City Walkability Assessment A spatial documentation of all sidewalks, curbs, and pedestrian obstructions. Assessment Performed June 2011. Silver City Walkability Assessment: Presentation Outline. Background Information (Who, What, When, & Where?)

E N D
Silver CityWalkability AssessmentA spatial documentation of all sidewalks, curbs, and pedestrian obstructions Assessment Performed June 2011
Silver City Walkability Assessment:Presentation Outline • Background Information (Who, What, When, & Where?) • The Need for a Walkability Assessment (Why?) • Methodology (How?) • Results: Prioritization & Baselines for Future Development • Benefits of such an Assessment • Questions & Answers
Background Information:Who? What? When? Where? Who: Partnership among BA to MD Students from UNM, Healthy Kids, Healthy Communities Grant County, Hidalgo Medical Services Residency Program, and the Town of Silver City What: The BA to MD students from UNM are required to complete a health-related community project during their residency, and they chose to focus on pedestrian accessibility as one of many indicators of public health. The goal of the assessment was to create a survey tool that would allow the Town to geographically analyze its pedestrian infrastructure (sidewalks and curbs) in any part of the community. When: The partnership completed the assessment over three weeks in June 2011; incomplete sidewalks were revisited in November Where: The assessment covers all sidewalks, curbs, and obstructions within the Town of Silver City
The Need for Pedestrian Safety:Four Core Reasons • Lack of sidewalk connectivity and access discourages outdoor activity, leading to an inactive population with high rates of obesity and obesity-related diseases • The Downtown Action Plan and the 2010 Silver City Downtown Metropolitan Redevelopment Area Designation Report specifically identify sidewalks as an opportunity for improvement • There are more vehicles than ever on NM roads and infrastructure must adapt to preserve pedestrian safety • Silver City has a comparatively high proportion of people who routinely walk to work
The Need for Pedestrian Safety:Lack of Connectivity Contributes to Obesity Research has shown that people are more likely to be physically active when they live in neighborhoods with better resources for exercise such as sidewalks, bike trails, parks and playgrounds. - RWJF, 2011 (http://www.rwjf.org/files/research/sdohseries2011neighborhood.pdf) Current overweight and obesity levels among children and adults indicate that additional infrastructure, education, and access to resources are needed to improve public health: - Around 40% of children in Grant County are overweight or obese (GCCHC, 2010-2011 BMI assessment) - 66% of adults are overweight or obese (CDC, 2011) Exercise is a proven method to prevent chronic disease!
The Need for Pedestrian Safety:Sidewalks Identified as an Opportunity for Improvement On October 12, 2010, the Town of Silver City passed Resolution 2010-30, which stated: NOW, THEREFORE, BE IT RESOLVED by the Council of the Town of Silver City, Grant County, New Mexico that: 1. The Town Council finds and determines that in downtown Silver City there are many deteriorated structures, sites and other declining improvements, unsafe conditions, long term consequences of obsolete and impractical planning and platting, and low levels of commercial activity that substantially impair and arrest the sound growth and economic well being of the area and the Town. 2. The Town Council finds and determines that this blighted area would benefit from a metropolitan redevelopment project or projects...
The Need for Pedestrian Safety:Sidewalks Identified as an Opportunity for Improvement “Streets, sidewalks, and curbs are patched and crumbling in many areas of downtown.” “Lack of sidewalks and curbcuts impairs the well being of the area.”
More vehicles than drivers starting in 1980 The Need for Pedestrian Safety:Most Vehicles on the Road in NM History Sources: US Census Bureau; “Highway Statistics” from 1940 – 2009 by the Federal Highway Administration, US Department of Transportation, available at www.fhwa.dot.gov/
The Need for Pedestrian Safety:High Gas Prices Encourage More Walking Monthly Average Gas Price for New Mexico, Past Five Years (prices are generally higher in Silver City) Source: Gas Buddy NM Historical Chart at www.gasbuddy.com
The Need for Pedestrian Safety:Silver City has a High Proportion of Walkers In Silver City, 9% of the working population routinely walks to work (does not include those who work from home) Is 9% a high proportion? As it turns out...
The Need for Pedestrian Safety:Silver City has a High Proportion of Walkers In Silver City, 9% of the working population routinely walks to work (does not include those who work from home) In fact, out of about 6,300 USA cities with at least 2,000 workers, Silver City ranks 341st in terms of percent of those who walk to work (top 6% of the country) Sources: US Census Bureau 2000, Table P30 “Means of Transportation to Work for Workers 16+ Years” (2010 data not yet available for our geography)
Methodology:Definitions Sidewalks Curbs Obstructions To ensure accuracy and eliminate subjective opinions, the definitions were structured in a simple, “Yes or No” manner. While a simplified methodology reduces some of the interesting, qualitative aspects of our infrastructure, it ensures data integrity and allows the Town to perform essential calculations and assessments.
Methodology:Definitions Sidewalks Curbs Obstructions Complete: The sidewalk is paved from curb to curb and a pedestrian is able to traverse the entire length without having to leave the sidewalk Partial: A portion of the sidewalk is paved, but the entire length is not paved from curb to curb or a pedestrian is forced off the sidewalk due to an obstruction or lack of right-of-way No Sidewalk: The sidewalk is not paved from curb to curb
Methodology:Definitions Sidewalks Curbs Obstructions Ramp: An ADA-accessible ramp is present at the sidewalk intersection Possible Ramp: A ramp is present at the sidewalk intersection; however, it is unclear if it meets ADA standards No Ramp: No ramp is present at the sidewalk intersection
Methodology:Definitions Sidewalks Curbs Obstructions Obstruction: A natural or human-made object that prevents a pedestrian from traversing the length of the sidewalk; common examples are utility poles, landscaping, and fences/walls; obstructions do not include impermanent objects (low-hanging tree limbs, parked cars, garbage cans, etc.)
Methodology:Process • The Town was divided into 23 sections and printed out as individual maps • The participants then walked or drove the streets with a clipboard and their paper map, and they color-coded their paper maps as follows: • Sidewalks: • Green: Complete • Red: Incomplete • Curbs: • Check: Ramp • Dot: Ramp, but might not be ADA accessible • An X: No Ramp • Obstructions were noted with an circle and a brief description • Sections that were deemed incomplete were revisited to map existing, partial sidewalks
Methodology:Process These maps were then digitized with the mapping program ArcGIS. With digital files, we can now create printable maps and perform spatial analysis.
Results:Overall Maps Sidewalks & Obstructions Curb Ramps
Results:What is the Purpose? • This assessment has three main purposes: • Provide the Town with a tool that allows it to prioritize sidewalk development • Empower the Town to calculate benchmarks concerning the current infrastructure • Enable the Town to adapt and update the maps in order to gauge progress • For example, here are some hypothetical priorities: • All streets within a tenth of a mile of each school should have sidewalks • Census Block Groups with a high proportion of children should have at least 50% sidewalk and curb ramp coverage • Census Block Groups with a high proportion of workers who walk to work should have at least 50% sidewalk and curb ramp coverage • Specialized Queries with Customized Geographies!
Examples:Can Kids Safely Walk to School? Tenth Mile Buffer around Sixth Street Elementary
Examples:Can Kids Safely Walk to School? Tenth Mile Buffer around Sixth Street Elementary Within 1/10 Mile: 44% of Sidewalks are Complete 14% of Sidewalks are Partially Complete 12% of Intersections have Ramps
Examples:Can Kids Safely Walk to School? Quarter Mile Buffer around Sixth Street Elementary Within 1/4 Mile: 50% of Sidewalks are Complete 10% of Sidewalks are Partially Complete 38% of Intersections have Ramps
Examples:Do Areas with Children have Sidewalks? Children 14 and Younger as a Percentage of Population by Census Block Group (2010)
Examples:Do Areas with Children have Sidewalks? Area with highest concentration of children 14 and younger (24.6%) Children 14 and Younger as a Percentage of Population by Census Block Group (2010)
Examples:Do Areas with Children have Sidewalks? In the Census Block Group with the Highest Proportion of Children: 42% of Sidewalks are Complete 10% are Partially Complete 28% of Intersections have Ramps About 25% of the population in the blue area is 14 or younger
Examples:Do Areas with Walkers have Sidewalks? Percent of Workers who Walk to Work by Census Block Group (2000)
Examples:Do Areas with Walkers have Sidewalks? Area with Highest Concentration of Those who Walk to Work (25%) Percent of Workers who Walk to Work by Census Block Group (2000)
Examples:Do Areas with Walkers have Sidewalks? In the Census Block Group with the Highest Proportion of Those who Walk to Work: 27% of Sidewalks are Complete 14% of Sidewalks are Partially Complete 7% of Intersections have Ramps 25% of the population in the blue area walks to work
Examples:Customized Geographies: Redevelopment Area The area outlined in red was officially designated as the Silver City Redevelopment Area. We can use the exact same redevelopment area to analyze the sidewalks and curbs to get a broader sense of downtown infrastructure.
Examples:Customized Geographies: Redevelopment Area In the Redevelopment Area: 60% of Sidewalks are Complete 9% are Partially Complete 54% of Intersections have Ramps
Examples:Various Technical Possibilities Can you get from A to B without leaving a sidewalk? Here, only CONTIGUOUS, complete sidewalks are displayed (no islands of sidewalks) to get a sense of the network.
Benefits to the Town of Silver City:Seamless, Empowering, Updatable, & Free Seamless: The spatial files can be integrated or “overlaid” on any existing Town map Empowering: Puts the analytical tools in the hands of the Town; prepares the Town for grants and contracts; positions the Town as a model community Updatable: As the infrastructure changes, so can the maps and analyses Free: The footwork, mapping, and file preparation were performed without charge
Benefits to the Town of Silver City:Seamless, Empowering, Updatable, & Free • The Town currently uses the mapping program ArcGIS 10. • This analysis used ArcGIS 10. • The transfer of information was as easy as copying and pasting. • Further, the sidewalks, curbs, and obstructions can be overlaid on existing maps with ease. • Zoning Map • Town Council District Map • Planning and Comprehensive Plan Maps • Open Space Maps
Benefits to the Town of Silver City:Seamless, Empowering, Updatable, & Free The spatial files can be easily integrated into the Town’s Pedestrian and Bicycle Routes Master Plan. Work is currently under way to combine resources while this plan is finalized. Also, the same calculations can be performed within ANY geography (How many curb ramps are there along the Pinos Altos corridor? How about in residential zones vs. commercial?)
Benefits to the Town of Silver City:Seamless, Empowering, Updatable, & Free • With an in-house tool, the Town has total control over: • Establishing areas or zones of improvement • Establishing benchmarks • Tracking progress • Adapting plans as needed • The Town will not have to rely upon a third-party firm, which usually provides fixed, unchangeable maps that cannot be integrated into existing plans.
Benefits to the Town of Silver City:Seamless, Empowering, Updatable, & Free This tool also bolsters the Town’s ability to meet current regulations & react to new sources of funding (STIP funds, shovel-ready project funds similar to ARRA, ADA transition funds, etc.). If a new federal grant for sidewalk improvements came along, Silver City already has assessments, priorities, and benchmarks in place, giving us a head start on the application process. There is a precedent of utilizing government funds for improving infrastructure embedded into the sidewalks themselves:
Benefits to the Town of Silver City:Seamless, Empowering, Updatable, & Free In a couple clicks, the status of sidewalks, curbs, and obstructions can be updated. New roads, sidewalks, and curbs can be added. The analysis can be re-calculated to track progress. As the Town changes, so can the map.
Benefits to the Town of Silver City:Seamless, Empowering, Updatable, & Free Phase 1: 24% of Sidewalks are Complete
Benefits to the Town of Silver City:Seamless, Empowering, Updatable, & Free Phase 2: 45% of Sidewalks are Complete
Benefits to the Town of Silver City:Seamless, Empowering, Updatable, & Free Phase 3: 85% of Sidewalks are Complete
Benefits to the Town of Silver City:Seamless, Empowering, Updatable, & Free Ten people had a direct hand in this project, amassing a total of about 100 working hours. Engineering and GIS consulting firms stated they would have charged between $50 - $100 an hour for such a project. Thus, for working time alone, this project would have cost the Town between $5,000 - $10,000, and this doesn’t include proprietary charges, tax, usage fees, and other secondary costs. Total actual cost to the Town: $0.00
Next Steps:Map Integration Jim Coates in the Community Development Office has been facilitating community input sessions in preparation for the Pedestrian and Bicycle Routes Master Plan. During these sessions, residents have been plotting: - Where they live - Destinations on foot & by bicycle - Destinations by vehicle With this information, Mr. Coates and other planners are developing transportation corridors throughout town. The sidewalk and curb assessment will add a deeper understanding of on-the-ground conditions for these corridors and their tributaries.
Summary &Contact • This Walkability Assessment Tool is in line with our Mission Statement: • It empowers the Town to achieve “guided growth” • It “facilitates health” by addressing safe, pedestrian access to parks, open space, trails, stores, and services • Walking and outdoor activities are inherently linked with “recreational opportunities” and a “high quality of life” • Smart Government = Effective Government • Questions about Childhood Obesity in Grant County: Contact Andrea Sauer at asauer@grmc.org • Questions about the HMS Residency Program: Contact Tammy Ahner at tahner@hmsnm.org • Questions about Mapping: Contact Andy Sauer at asauer@hmsnm.org