Download

1 / 28
280 likes | 360 Views
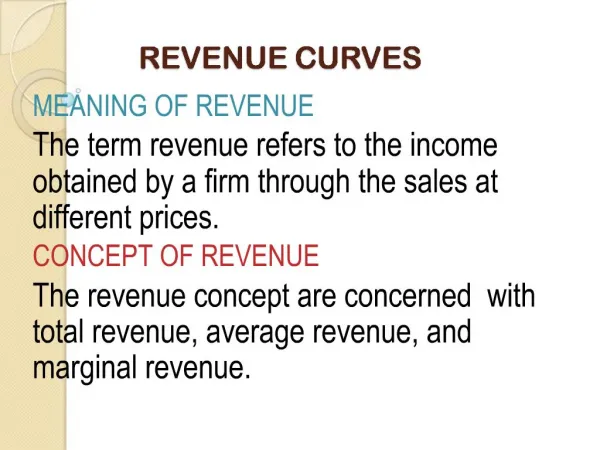
Revenue Curves, Types of Profits. Revenue curves of the business. As a business we need to know the most profitable output we can produce. To find out how we can be the most profitable we need to understand more about the relationship between the revenue and cost curves of the business.

E N D
Revenue curves of the business • As a business we need to know the most profitable output we can produce. • To find out how we can be the most profitable we need to understand more about the relationship between the revenue and cost curves of the business Revenue = Income producers receive from selling goods and services on the market
Normal Profit for a business is where: Total Cost =Total Revenue TC=TR Profit • Profit depends on • The price the goods are sold for • How much is sold • Cost of production Profit = Revenue- Costs Entrepreneurs include a return for risk in their costs of production this is why at TC=TR we call it normal profit even though there doesn’t appear to be any at all. Includes rent wages interest and other costs of production Income from sales
Revenue Curves • Total Revenue (TR) = Price X Quantity of units sold • Calculate the TR for a farmer that sells sheep at $40 each and sells 300 sheep. • TR= 40 x 300 = $12,000 • Average Revenue (AR) is the average contribution of each unit sold to TR. AR will be the same as price and is represented by the demand curve AR= TR/Q What's the AR for the above situation? 12,000/300 = 40 = Price per sheep • Marginal Revenue (MR) is the additional revenue the firm receives from the sale of one more unit of output. Its calculated by the change in TR MR= TR2-TR1
Types of Profit • Supernormal Profit • TR>TC • Supernormal profit will attract other businesses into the industry in the Long-run. Thus can only be achieved in the Short Run • Subnormal profit • TR<TC • Subnormal profit may be sustainable in the short-run if you are covering variable costs
Comparing Equilibrium situations for Monopoly and perfect Competition
Perfect Competition Deriving the demand curve Demand curve for the perfectly competitive firm Market Price S Price 60 50 40 30 20 10 0 60 50 40 30 20 10 0 P D D 1 2 3 4 5 6 Q 10 20 30 40 50 60 Quantity (million) Output (000) Because the perfectly competitive firm is a price-taker it faces a horizontal demand curve. The price is determined by demand and supply in the market.
Example revenue curves for perfectly competitive firm TR 200 160 120 80 40 0 AR/MR/D 1 2 3 4 5 As a price taker, a perfectly competitive firm faces a price of $60 regardless of the amount they sell. This firm cannot affect this price in any way. The demand curve is horizontal. This means the firm can sell unlimited quantities at the same price (AR=MR).
Cost Structures for perfect competitors • The two most important curves to remember are the • Marginal cost curves “the big tick” • Average cost curves “the fruit bowl” The marginal cost curve always cuts the AC curve at its lowest point.
Perfectly competitive firm P MC Profit maximising equilibrium output is where MR=MC AC MR/AR/D Q
Normal Profits • A firm will be earning normal profit when the revenue is sufficient to cover all the costs • AR=AC. • Remember the costs of production include • Rent, paid for land • Wages paid to labour • Interest paid to capital • Profit paid for enterprise MC AC AR Normal profit AR=AC
Subnormal Profit • Where the firms costs are greater than its revenue the firm is earning subnormal profits. • It is quiet possible for the firm to be earning accounting profits but because our opportunity costs may be high it may be making an economic loss MC AC AR
SUPERNORMAL PROFIT • Where the firms costs are greater than its revenue the firm is earning subnormal profits. • Only a Monopolist can sustain supernormal profits in the long run. • Perfect competitors will make normal profits in the long run, as other firms will easily enter the market, being attracted to the supernormal profits, thus increasing supply and resulting in normal profits MC AC AR
Making Subnormal Profits • If, in the short run firms are making subnormal profits in a perfectly competitive industry then in the long run some firms will exit the industry. As firms exit the industry the market supply will decrease and consequently the market price will increase. An increase in the market price will mean an increase in average revenue for the remaining firms. In the long run subnormal profits will be replaced by normal profits and only normal profits will be made in the long-run Making Supernormal Profits If firms are making short-run supernormal profits in a perfectly competitive industry then in the long- run new firms, attracted by the prospect of supernormal profits will enter the industry. As new firms enter the industry the market supply will increase resulting in a fall in the market price. A fall in the price will mean a fall in average revenue for the firms. Supernormal profits will be reduced and in the long-run only normal profits will be made. Making Normal Profits Perfectly competitive firms making normal profits in the short-run will continue to do so in the. There is no incentive for firms to either exit or enter the industry. Market supply does not change neither does the price nor average revenue. Normal profits will continue.
Perfectly Competitive MarketUsing Marginal Analysis At Q1 MR > MC Therefore the firm should increase output to gain more profit on the additional units of output sold At Q3 MC>MR, therefore the firm should decrease output to avoid making a loss on the additional units of output sold Q1 Q2 Q3
Characteristics of a Monopolist • A monopolist firm is the only supplier of a good or service in a market. • The revenue curves for a monopoly are different from those of a perfect competitor. • The monopolist is able to restrict output so that a high price can be charged, this means in order to sell more product the monopolist must drop its price. • Sound similar to the LAW OF DEMAND? • As price decreases quantity demanded increases • This must mean the monopolist must have a downwards sloping demand curve! • AR=D
Revenue Curves for the Monopolist • The AR curve is the firms demand curve • Both the AR and MR are downwards sloping, but AR < MR • When TR is increasing, MR is positive • When TR is decreasing, MR is negative • When TR is at its maximum MR=O
Comparing Demand Curves Horizontal Downwards sloping Price Taker Only producer, Price setter MR<AR AR=MR
Profit Maximising Equilibrium for the Monopolist • To identify the profit maximising equilibrium position for the monopolist firm. • 1. Find where MR=MC, from this position draw a dashed line directly down to horizontal axis, (Qe) • 2. Continue this dashed line vertically till you reach the AR curve, then take this line to the vertical axis (Pe) To identify AC at profit max level. Find where the line goes vertically up from Qe and reaches the AC curve take this then to the vertical (price axis) point c Total supernormal profit Pe, a, b, c
Differing profit situations for the monopolist Profit Situations • These are assessed in the same way as perfect competitors- at the profit maximising level of output • If • AR < AC Subnormal Profits • AR=AC Normal Profits • AR > AC Supernormal Profits
What happens in the SR and LR for a Monopoly? • In the short run, a monopoly must stay in the industry no matter what the profits position , as at least on factor is fixed. In the Long Run • Earning a supernormal profit – this situation will continue as strong barriers to entry prevent any other firms entering the market • Earning a normal profit – a firm will continue to operate, as it is earning just enough profit to be worthwhile • Earning a subnormal profit – a firm will leave the market as better returns can be gained else where
Barriers to entry • Barriers to entry- strategies available that will stop new firms from entering a market • This means, existing firms will be able to keep earning supernormal profits in the long run. • Examples of barriers to entry • Patents – give the firm intellectual property rights over a new invention • Predatory pricing – policies to cut prices to a level that would force any new entrants to operate at a loss • Cost Advantages- resulting from economies of scale (allowing them to undercut price) • Spending on R&D (research and development) • Producing a good with no close substitutes • Advertising and marketing – competitors find it expensive to break into the market
Monopoly VS Perfect Competition • Compared to a perfectly competitive firm a monopoly will • Deliberately restrict output • Set a price higher than MC • Be able to earn supernormal profits in the LR. • Not achieve the efficient level of output where AR=MR
Monopoly VS Perfect Competition • However there are some situations where the monopolist can provide some advantages to society • Supernormal profits can be used to pay for R&D which could lead to further efficiencies • If the monopolist is earning sufficient economies of scale a firm could charge a price below that of a competitive firm.
Loss of Allocative EfficiencyWork book page 73 • In a perfectly competitive market, price is set by demand and supply at market equilibrium, so the market is allocatively efficient • Curves of a monopolist • Demand curve is downwards sloping • MR< AR • The monopoly restricts output to the profit maximising level where MR=MC Where MR=MC, the monopolist charges a higher price and lower output than the market equilibrium where MC (S) = AR (D) The allocative efficient level of output is where AR=MC Deadweight loss will exist. . Deadweight loss (DWL) = Represents a loss of allocative efficiency that is lost to the market
Government Policies and Monopolies • Because monopolists operate at a non allocative efficient point governments may choose to intervene in the following ways • Price Controls -Force the monopoly to operate at a price where AR=MR (called marginal cost pricing ) If costs are too high the firm may be forced into a subnormal profit. As a result the government may need to subsidise the firm - Force the monopoly to operate where AR=AC (called average cost pricing) The firm will then be making a normal profit and it will be operating at a close to the allocatively efficient point. • Remove all artificial barriers to entry for a firm – e.g legal barriers • Encourage/legislate competition – forcing monopolies to share facilities • Force any parts of a monopoly that can be broken up to be sold