Download
1 / 66
680 likes | 968 Views
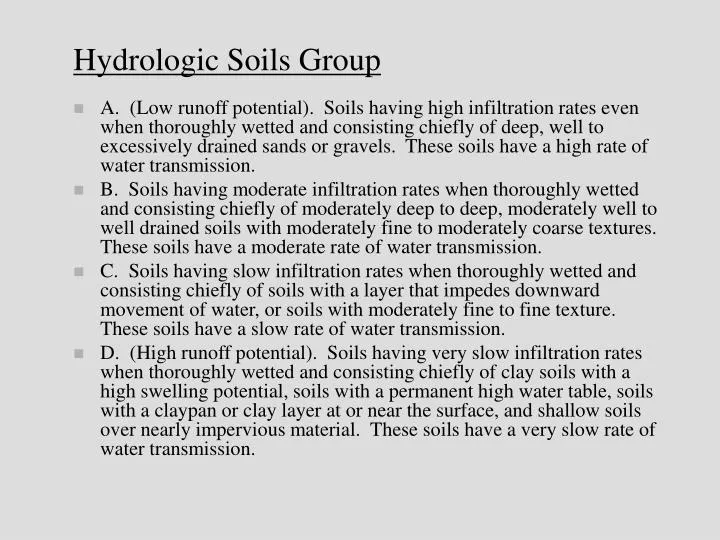
Hydrologic Soils Group. A. (Low runoff potential). Soils having high infiltration rates even when thoroughly wetted and consisting chiefly of deep, well to excessively drained sands or gravels. These soils have a high rate of water transmission.

E N D
Hydrologic Soils Group • A. (Low runoff potential). Soils having high infiltration rates even when thoroughly wetted and consisting chiefly of deep, well to excessively drained sands or gravels. These soils have a high rate of water transmission. • B. Soils having moderate infiltration rates when thoroughly wetted and consisting chiefly of moderately deep to deep, moderately well to well drained soils with moderately fine to moderately coarse textures. These soils have a moderate rate of water transmission. • C. Soils having slow infiltration rates when thoroughly wetted and consisting chiefly of soils with a layer that impedes downward movement of water, or soils with moderately fine to fine texture. These soils have a slow rate of water transmission. • D. (High runoff potential). Soils having very slow infiltration rates when thoroughly wetted and consisting chiefly of clay soils with a high swelling potential, soils with a permanent high water table, soils with a claypan or clay layer at or near the surface, and shallow soils over nearly impervious material. These soils have a very slow rate of water transmission.
Curve Number S = Potential Maximum Retention Ia = Initial Abstraction Define Ia = 0.2S
Assume D Type Soil • From Table 602 • Assume D Type Soil • From Table 602
Assume D Type Soil • From Table 602 • Paved Parking Lot CN = 98 • Grass (Good Condition) CN = 80 • Weighted CN • Assume D Type Soil • From Table 602 • Paved Parking Lot CN = 98 • Grass (Good Condition) CN = 80 • Weighted CN
Assume 50% A Type Soils • From Table 602 • Parking D = 98, A = 98 • Grass D = 80, A = 39 • Weighted CN
Storm Runoff Methods: • Stream Gage - History • Hydrograph • NRCS • Snyder • Clarke • Unit • Rational Method (Ireland 1895)
Unit Hydrograph Definition: A unit hydrograph is a hydrograph of a storm dropping 1-inch of excess precipitation evenly on the entire watershed
Unit Hydrograph Assumptions: • All storms in the watershed have the same duration • The time is constant for all storms • The shape of the rainfall curve is the same for all storms • Only the total amount of rainfall varies from storm to storm Note: Generally, storm duration differing up to ±25% are considered to be equivalent.
Unit Hydrograph A unit hydrograph is developed by dividing every point on the overland flow hydrograph by the average excess precipitation, Pave, excess. Once a unit hydrograph has been developed from historical data of a particular storm volume, it can be used for other storm volumes.
Unit Hydrograph The hydrograph of a storm producing more or less than 1 in (1 cm) of rain is found by multiplying all ordinates on the unit hydrograph by the total precipitation of the storm.
Unit Hydrograph V = AdPave,excess
Unit Hydrograph After a 2-hour storm, a station downstream from a 45 mi2 drainage watershed records a peak discharge of 9400 ft3/sec and a total runoff of 3300 ac-ft: • What is the unit hydrograph peak discharge? • What would be the peak runoff and design flood volume if a 2-hour storm dropped 2.5-inch net precipitation? Civil Engineering Reference Manual for the PE, by Michael R. Lindeburg, PE
Unit Hydrograph A 6-hour storm rains on a 25 mi2 drainage watershed. Records from a stream gauging station are shown: • Construct the unit hydrograph for the 6-hour storm. • Find the runoff rate at t = 15 hours from a two-storm system if the first storm drops 2 inches starting at t = 0 and the second storm drops 5 inches starting at t = 12 hours. Civil Engineering Reference Manual for the PE, by Michael R. Lindeburg, PE
Unit Hydrograph 1200 400
Rational Method Q = CIA (Mod. Rational Q = KCIA) acre·in/hr cfs C = Runoff Coefficient I = Average Intensity (inch/hr) A = Area (Acres) Assumptions: • Uniform rainfall • Tc = Time for runoff from farthest point in the watershed • No volume • Good for small areas w/uniform land use
10-yr Return Period • C: (From Table 601) • Parking C = 0.9 • Grass C = 0.1 • C = 0.5) – See Figure 602 • C = 0.5 • Grass 330’ @ 0.7 fps = 471 s 636 s = 10.6 min • Tt 660’ @ 2.1 fps = 314 s = 5.2 min Tc = 15.8 min
10-yr Return Period • C = 0.5 • I : Tc = Ti + Tt (5 min. minimum) – See Figure 602
10-yr Return Period • C = 0.5 • I : Tc = Ti + Tt (5 min. minimum) – See Figure 602 • Ti Paved 330’ @ 2 fps = 165 s Grass 330’
10-yr Return Period • I : Tc = Ti + Tt (5 min. minimum) – See Figure 602 • Ti Paved 330’ @ 2 fps = 165 s Grass 330’ @ 0.7 fps = 471 s 636 s = 10.6 min
10-yr Return Period • I : Tc = Ti + Tt (5 min. minimum) – See Figure 602 • Ti Paved 330’ @ 2 fps = 165 s Grass 330’ @ 0.7 fps = 471 s 636 s = 10.6 min • Tt 660’ @ 2.1 fps = 314 s = 5.2 min Tc = 15.8 min
10-yr Return Period • I : From Figure 517, Tc = 15.8 I = 2.9 in/hr
10-yr Return Period • C = 0.5 • I = 2.9 in/hr • A = 10 acres Q = C I A Q = 0.5·2.9·10 = 14.5 15 cfs
10-yr Return Period • 18” Storm Drain
10-yr Return Period • 18” Storm Drain • Hydraulic Wheel → V = 8.5 fps
10-yr Return Period • 18” Storm Drain • Hydraulic Wheel → V = 8.5 fps • Tt = 660/8.5 = 77.6 s = 1.3 min • Tc = 15.8 + 1.3 = 17.1 I = 2.78 in/hr
10-yr Return Period • 18” Storm Drain • Hydraulic Wheel → V = 8.5 fps • Tt = 660/8.5 = 77.6 s = 1.3 min • Tc = 15.8 + 1.3 = 17.1 I = 2.78 in/hr • Q = 0.5·2.78·20 = 27.8 28 cfs
1. Start @ soffit or HW line, whichever is higher: HGL = 102.00 EGL = 102.35 V = 4.77 fps V2/2g = 0.35 ft 2. Bernoulli Equation:
1. Start @ soffit or HW line, whichever is higher: HGL = 102.00 EGL = 102.35 V = 4.77 fps V2/2g = 0.35 ft • Bernoulli Equation:
Bernoulli Equation: • 1→2 Manning’s Equation: