Download

1 / 22
260 likes | 562 Views
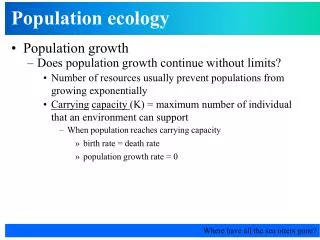
The Human Population: Growth, Demography, and Carrying Capacity. G. Tyler Miller’s Living in the Environment 12 th Edition Chapter 11. Dr. Richard Clements Chattanooga State Technical Community College. Key Concepts. Factors affecting human population size. Human population problems.

E N D
The Human Population: Growth, Demography, and Carrying Capacity G. Tyler Miller’s Living in the Environment 12th Edition Chapter 11 Dr. Richard Clements Chattanooga State Technical Community College
Key Concepts • Factors affecting human population size • Human population problems • Managing population growth
Factors Affecting Human Population Size Population Change = (Births + Immigration) – (Deaths + Emigration) • Population change equation • Zero population growth (ZPG) • Crude birth rate (BR) = births per 1000 population • Crude death rate (DR) = deaths per 1000 population
Natural Rate of Increase Annual world population growth <1% 1-1.9% 2-2.9% 3+% Data not available Fig. 11.3, p. 240
Fertility Rates Births per woman < 2 4-4.9 2-2.9 5+ No Data 3-3.9 • Replacement-level fertility • Total fertility rate (TFR) Fig. 11.8, p. 242
Factors Affecting BR and TFR 32 30 28 26 24 Births per thousand population 22 20 World War II 18 Demographic transition 16 Depression 14 Baby bust Baby boom Echo baby boom 0 1910 1920 1930 1940 1950 1960 1970 1980 1990 2000 2010 Year • See bulleted list in text p. 243 • US BR’s and TFR’s Fig. 11.11, p. 243 see Fig. 11-10 p. 243
Birth rate and fertility rate influenced by Importance of children as part of labor force Urbanization Cost of raising and education children Education and employment opportunities for women Infant mortality rate Average age at marriage
Birth rate and fertility rate influenced by Availability of pensions Availability of reliable birth control Availability of legal abortions Religious beliefs and traditions Cultural norms
Useful indicators of overall health of a country Infant deaths per 1,000 live births <10 <10-35 <36-70 <71-100 <100+ Data not available • Life expectancy • Infant mortality rate (IMR) Fig. 11.14, p. 246
Factors affecting death ratesPeople live longer because of Increased food supplies and distribution Better nutrition Better health care - types of and access to medicine, immunizations, antibiotics, pre- natal care Improved sanitation and personal hygiene - prevents spread of infectious diseases that may kill early in life Safer water supplies prevents spread of infectious diseases that may kill early in life
Factors Affecting Natural Rate of Increase Rate of natural increase = crude birth rate = crude death rate Developed Countries Developed Countries 50 50 Crude birth rate Rate of natural increase 40 40 Rate of natural increase Crude birth rate Rate per 1,000 people Rate per 1,000 people 30 30 Crude death rate 20 20 Crude death rate 10 10 Year Year 0 0 1800 2000 1775 1850 1900 1950 2050 1800 2000 1775 1850 1900 1950 2050 Fig. 11.13, p. 245
Infant mortality is the death before the 1st birthdayHigh infant mortality rate usually results from Insufficient food (undernutrition) Poor nutrition (malnutrition) High incidence of infectious diseases due to contaminated drinking water or poor sanitation
Population Age Structure Male Female Rapid Growth Guatemala Nigeria Saudi Arabia Slow Growth United States Australia Canada Zero Growth Spain Austria Greece Negative Growth Germany Bulgaria Sweden Ages 0-14 Ages 15-44 Ages 45-85+ Fig. 11.16a, p. 247
Solutions: Influencing Population Size • Migration • Environmental refugees • Reducing births • Family planning • Empowerment of women • Economic rewards and penalties
The Demographic Transition Stage 1 Preindustrial Stage 2 Transindustrial Stage 3 Industrial Stage 4 Postindustrial High 80 70 60 Birth rate 50 Birth rate and death rate (number per 1,000 per year) Relative population size 40 30 Death rate 20 10 Total population Low 0 Low growth rate Increasing Growth growth rate Very high growth rate Decreasing growth rate Low growth rate Zero growth rate Negative growth rate Time Fig. 11.26, p. 255
The Demographic Transition Stage 1 Preindustrial Stage 2 Transindustrial Stage 3 Industrial Stage 4 Postindustrial High 80 70 60 Birth rate 50 Birth rate and death rate (number per 1,000 per year) Relative population size 40 30 Death rate 20 10 Total population Low 0 Low growth rate Increasing Growth growth rate Very high growth rate Decreasing growth rate Low growth rate Zero growth rate Negative growth rate Time Pre-industrial -- high birth rate and high death rate (including high infant mortality rate), harsh living conditions Fig. 11.26, p. 255
The Demographic Transition Stage 1 Preindustrial Stage 2 Transitional Stage 3 Industrial Stage 4 Postindustrial High 80 70 60 Birth rate 50 Birth rate and death rate (number per 1,000 per year) Relative population size 40 30 Death rate 20 10 Total population Low 0 Low growth rate Increasing Growth growth rate Very high growth rate Decreasing growth rate Low growth rate Zero growth rate Negative growth rate Time Transitional - industrialization begins, trend to urbanization, food supply increases and health care is better, death rates drop BUT birth rates remain high Fig. 11.26, p. 255
The Demographic Transition Stage 1 Preindustrial Stage 2 Transitional Stage 3 Industrial Stage 4 Postindustrial High 80 70 60 Birth rate 50 Birth rate and death rate (number per 1,000 per year) Relative population size 40 30 Death rate 20 10 Total population Low 0 Low growth rate Increasing Growth growth rate Very high growth rate Decreasing growth rate Low growth rate Zero growth rate Negative growth rate Time Industrial - modernization becomes widespread, birth rates now drop to nearly equal death rate, pop growth is slow Fig. 11.26, p. 255
The Demographic Transition Stage 1 Preindustrial Stage 2 Transitional Stage 3 Industrial Stage 4 Postindustrial High 80 70 60 Birth rate 50 Birth rate and death rate (number per 1,000 per year) Relative population size 40 30 Death rate 20 10 Total population Low 0 Low growth rate Increasing Growth growth rate Very high growth rate Decreasing growth rate Low growth rate Zero growth rate Negative growth rate Time LDC MDC Post-Industrial - birth rates are now well below death rates Most European countries have entered this stage Fig. 11.26, p. 255
Case Study: Slowing Population Growth in India Generally disappointing results: • Poor planning • Bureaucratic inefficiency • Low status of women • Extreme poverty • Lack of support
Case Study: Slowing Population Growth in China Generally positive results: • Economic incentives • Free medical care • Preferential treatment • Intrusive and coercive • Locally administered
Cutting Global Population Growth • Family planning • Reduce poverty • Elevate the status of women