Transect Sampling Methods for Minority Genetic Epidemiology Study
180 likes | 306 Views
Explore transect sampling method for Asian sub-populations in the genetic epidemiology study in St. Louis. Assess acculturation, alcohol sensitivity, and genetic factors. Supported by the Missouri Alcohol Research Center.

Transect Sampling Methods for Minority Genetic Epidemiology Study
E N D
Presentation Transcript
Transect Sampling Methods for a Minority Population Genetic Epidemiology Study Nathan K. Risk, M.A. Krista L. Russell, B.A. Rumi Kato Price, Ph.D., M.P.E. *This study is supported by the Missouri Alcohol Research Center (MARC). (P50AA1198, Center Director Andrew C. Heath, D. Phil)
Abstract The Saint Louis Asian American Pilot Study is conducted under the auspices of the Missouri Alcohol Research Center (MARC). It proposes to conduct a cross sectional assessment in two Asian sub-populations, the Japanese and the Vietnamese residing in the Saint Louis Area. Current population-based sampling methods that require sampling frames are unlikely to be suitable for efficiently sampling members of a small population. The population distribution in the Saint Louis area is not large enough to make the census-based sampling method reasonable. Although there are a number of other sampling methods that do not require sampling frames, the “transect” sampling derived originally from wildlife biology is a particularly flexible method. This presentation will show: 1) the need for ascertaining the Asian sub-population in the United States; 2) the basics of the transect sampling method in wild-life biology; 3) the adaptation of the transect sampling method for the Saint Louis Asian population; and 4) simulated data that examines the robustness of transect sampling under various assumptions.
Introduction (1) In Table 1, the rates of current drinking are reported separately for people of Asian decent who self identify as white versus people of Asian descent who self-identify as Asians using NLAES1. The results show that the rates of drinking are higher among Asians who self identify as white2. In Table 2, the rates of current drinking are reported separately for unmixed and mixed Asian adolescents using Add Health.3 The results consistently show that the rates of current drinking are higher among Asians of mixed heritage2. It is an aim of this pilot study to examine the relative strength of acculturation measures such as mixed heritage on substance use and problem use in these two community samples. The deficiency of the ALDH2 isozyme is known to cause a high sensitivity to alcohol among Asians4. This sensitivity is known as the “flushing syndrome.” There is also some evidence for a correlation of the wild type CYP2A6*1 with tobacco dependence5. Mutations of CYP2A6 have been reported at a higher frequency among Asians6,7. Genotypic frequencies are given in Table 3. It is an aim of the pilot study to assess the feasibility of genotype collection for these two alleles for the Japanese and Vietnamese populations in Saint Louis, since genotypic distributions among Asians in the U.S. are expected to be substantively different from those in their native lands given the high rate of inter-racial reproduction currently on-going in the U.S.
Table1. Drinking by Racial Identity (%) (Asian n=922) Source: NLAES, 1992, Price, et. al., 2002. *, rate significantly higher among those identified themselves as whites; ##, unreliable estimates due to small numbers of Asians who identified themselves as whites.
Table 2. Drinking among Adolescent Asians by Multiple Racial Identity1 (Asian n = 4,012) Racial identity: Japanese Filipino Chinese Korean Vietnamese Unmixed Asian 24.5 24.3 9.7 17.1 12.9 Mixed Asian 39.2* 40.6* 41.7* 33.7* 49.4* Source: Add Health S-95, Price et al, 2002. 1. Mixed Asian are those who reported at least one more race. Multiple choices for Asian ethnicity allowed. Weighted to be generalizable to the U.S. Population of adolescents in grade 7 through 12 in 1994-6. Standard errors adjusted using SUDAAN. *, significantly larger than unmixed Asians.
Table 3. Genotype Distributions of ALDH2 and CYP2A6 ALDH2 CYP2A6 Genotypes (%) Allelic (%) Frequency 1 2 n n *1/*1 *2/*1 *2/*2 6*1 6*2( 1) 6*3( 3) 3 4 4 4 Caucasian 100 0 0 85 15 0 5 5 ? 98.6 1.4 Japanese 56.4 39.4 4.2 52 20 28 Filipino 87.3 12.7 0 Not Available Korean 71.6 26.6 1.8 Not Available 6 6 6 Chinese 59.0 35.9 5.1 83 11 6 Vietnamese 43.0 57.0 Not Available Source Harada, 1991; Goedde et al., 1985; 1. Wildtype 2. Inactive 3. European 4. Finnish based on the PCR amplifisters confined with diagnostic restriction digestion. 5. Finnish, based on a two-step PCR method 6. Taiwanese
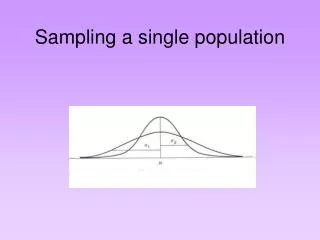
Introduction (2) In any study of a minority population, ascertainment of a representative sample is a challenge. It is possible to ascertain a sample randomly by selecting blindly from the total population and accepting only respondents from the minority in question, but such an approach is prohibitively expensive. It is also tempting to enter the minority community at a few points and select respondents from a few well known centers of the community. Such an approach may well succeed in meeting the ascertainment goal, but the sample may not reflect the minority community under study as a whole. In wild-life biology, transect sampling is used to ascertain a representative sample of the population of a given species by traveling along randomly chosen paths or “transects”. Observations of the species are noted and the distance to the observation from the transect is recorded (Figure 1). Since members of a species further from the transect are less likely to be spotted, the density of the species is estimated by fitting the percentage of observations made to distance. Several parametric methods for this fitting exist8. (Figure 2)
Figure 1. Transect Sampling Along Paths Observation Transect Distance Blow-up detail of an observation and a transect.
Figure 2. Methods of Density Estimation in Transect Sampling Density of Detections Density of Detections Distance Distance Exponential Half - Normal Source: Thompson, 1992.
Method (1) This pilot study adapts a transect sampling method for the purpose of ascertaining the Japanese and Vietnamese samples residing in Saint Louis (Table 5 on sister poster.) The Japanese sub-population is centered in two bands, Brentwood to Chesterfield and University City to Olivette (Figure 3). The Vietnamese population is also centered in two bands, Olivette to Maryland Heights and South City to South County (Figure 4). The entry points into this population will be by community organizations and retail services that serve the minority community. Instead of the path method commonly used in transect sampling, each entry point into the community will recruit by advertisement. For the ascertained sample to successfully represent the community, the entry points must be scattered thoroughly throughout the community. By selecting a large variety of community organizations and retail services (Figure 5), the pilot study hopes to ascertain a representative sample from the respective populations in a cost-efficient manner.
Figure 3. Distribution of the Japanese Population in Saint Louis Brentwood-Chesterfield University City-Olivette
Olivette-Maryland Heights South City - South County Figure 4. Distribution of the Vietnamese Population in Saint Louis
X Japanese Vietnamese Pan-AsianO Figure 5. Map of Community Organizations and Service Providers1 X X X X X X O X X X X X XX O X O X O O O X O X O 1. The list is recompiled periodically.
Method (2) In order to test the effectiveness of transect sampling, several simulations were performed.The basic simulation was a four-strata simulation. The strata were geographically assigned to the four corners of the sample space (Figure 6). This mimics the actual geographic lay-out of the Japanese residing in Saint Louis County. Twenty entry points were placed among the strata. Each entry point was given a randomly assigned popularity score. Observations were randomly assigned to a location inside of their strata and each observation was randomly assigned a binary score (such as mixed- heritage or high-school education) for Traits A and B based on the strata they were in. For each entry point, a person (observation) would randomly visit that entry point based on the popularity of the entry point and the distance of the person from the entry point. A person visiting any entry point was considered to be sampled. For Simulation 1, all observations behaved similarly. For Simulations 2-5, observations from strata 1 were less likely to visit distant entry points and hence less likely to be sampled while observations from strata 2 were more likely to visit distant entry points and hence more likely to be sampled.
Figure 6. Four Strata Simulation with 20 Entry Points Strata 1 Strata 3 Strata 2 Strata 4
Results • For Simulation 1 (Table 4), when all members of the population respond similarly to the distance to entry points, each strata is sampled at a similar rate (18.6, 18.8, 18.6, 18.9) and therefore the sample proportion of Traits A and B is similar to the population proportion of Traits A and B (47.1 versus 47.3 and 32.1 versus 32.1 respectively) • For Simulations 2-5, as strata 1 becomes sampled at an increasingly lower rate and strata 2 becomes sampled at an increasingly higher rate, the sample proportions of Traits A and B vary to an increasing extent from the population proportion of Traits A and B. • The estimator of pi, pi is generally adequate, but tends to be lower than pi, since it is biased low by definition. An increased number of entry points and an even sampling across entry points will reduced this bias. • Transect sampling is a reasonable method to obtain a representative sample if enough entry points are provided for each strata of the population. It is also feasible to measure the effectiveness of this sampling strategy for equality of sampling across strata.
2*(number of observations sampled more than once in strata i) pi = (number of observations sampled at least once in strata i) pi is an estimate of pi. Actually, pi is the probability of visiting any of 19 entry points instead of any of 20 entry points. Therefor it has a low bias for estimating pi. Table 4. Simulation Results Traits A and B give the sampled proportion of Traits A and B in each simulation. pi is the sampling proportion of strata i, (i.e. the proportion of observations that visited any of the 20 entry points.)
Literature Cited 1. National Institute on Alcohol and Abuse and Alcoholism. National Longitudinal Epidemioligic Alcohol Survey: Wave 1 Questionnaire. Rockville (MD): NIAAA; 1991. 2. Price, RK, et al. Substance Use and Abuse by Asian Americans and Pacific Islanders: Preliminary Results from Four National Epidemioligic Studies. Public Health Reports; 2002; 39-49 3. National Longitudinal Study of Adolescent Health. Research Design. Chapel Hill (NC): Carolina Population Center, Univ of North Carolina; 1998. 4. Crabb DW, et al. Genetic factors that reduce risk for developing alcoholism in animals and humans. In Begleiter H, Kissin B (eds.), The genetics of alcoholism. New York (NY): Oxford University Press, 1995; 202-220 5. Wellington C. Genes and tobacco dependence (a review). Clin Genet 1998; 54266-267. 6. Yokoi T, Kamataki T. Genetic polymorphism of drug metabolizing enzymes: New mutations in CYP2D6 and CYP2A6 genes in Japanese. Pharmaceut Res 1998; 15:517-524. 7. Oscarson M, et. al .Characterisation and PCR-based detection of a CYP2A6 gene deletion found at a high frequency in a Chinese population. FEBS Letters 1999; 448:105-110. 8. Thompson, S.Sampling. New York (NY): John Wiley and Sons, Inc., 1992