Download

1 / 37
370 likes | 486 Views
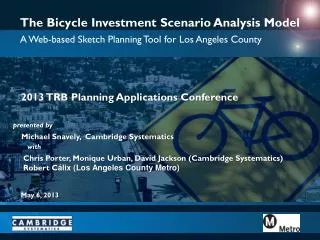
The Bicycle Investment Scenario Analysis Model. A Web-based Sketch Planning Tool for Los Angeles County. 2013 TRB Planning Applications Conference. May 6 , 2013. Michael Snavely, Cambridge Systematics. presented by. with. Chris Porter, Monique Urban, David Jackson ( Cambridge Systematics)

E N D
The Bicycle Investment Scenario Analysis Model A Web-based Sketch Planning Tool for Los Angeles County 2013 TRB Planning Applications Conference May 6, 2013 Michael Snavely, Cambridge Systematics presented by with Chris Porter, Monique Urban, David Jackson (Cambridge Systematics) Robert Cálix (Los Angeles County Metro)
Agenda • Background / Context • Model Structure • Trip Estimation Models • Application: User Interface • Conclusion / Results
Background – Cycling in Los Angeles • 1897 - First Class I Bike Facility in US: California Cycle-Way (LA – Pasadena) • Privately funded &: tolled (10¢ per trip) • Replaced by Red Car prior to completion • 1951: right-of-way becomes Arroyo Seco Parkway • Bicycling in LA County Today: • Over 1000 planned bikeway miles • Cycling visibility • Mayor’s accident • Advocacy presence • Bikesharing (DTLA, SM, LB) • Countywide demand for active transportation alternatives
Background - Policy Context • 2008 – 2012: Countywide Congestion Mitigation Fee Pilot Study • 1/3 of projects submitted by cities (close to $1B) are bicycle related • No way to estimate benefits • 2012: Metro Board calls for tools to estimate impacts • 1) Sketch-planning tool (zonal) • Must be web-based • Accessible to all 89 jurisdictions • 2) Travel demand model component (network) • Late 2014
Regional Context – Existing Bicycle Mode Share Average bicycle work-trip mode share = 0.75%
Methodology – Guiding Principles • Enable easy web-based access for cities • Complete within 1 year (no new data collection) • Impacts should be sensitive to local conditions • To extent possible, estimate impacts of: • Bikeways, • Bike Parking Facilities, and • Bike Sharing Programs • Sketch-level scenario analysis • Provide “order of magnitude” estimate of benefits • Include recreational bicycling impacts
Methodology – Data Sources • American Community Survey (2007-2011) • Population, Age, Income, Employment (census tract level) • SCAGMPO Data (2008) • Land Use Types • SE Forecasts • National Household Travel Survey (2009) • Cycling Travel Behavior • Metro Facility geodatabases • Cycling conditions: • Street Grades, Intersections, Bike Facilities, etc.
Model Application • Bikeway trip estimation models • “Local data” stored in census tract (SE data, land use, facilities) • Assumption: higher bikeway facility density greater # bike trips • Neighboring zones’ land use and infrastructure also affect propensity to bike • Off-model research-based adjustments for: • Workplace parking /showers • Transit station bicycle parking • Bikesharing Programs • Results summarized at jurisdiction level for scenario analysis
Methodology – Bikeway Projects User-Defined GIS Calculation Fixed Areal Factors Influence Project Impact Census Tract Project shapefile New Bikeway Type Socioeconomic Age Education Population Jobs Bikeway Attributes Income Sex Car Ownership Project Location Land Use & Facilities Grade Density Bike Facilities Car Traffic Cycling Conditions Work / Utilitarian Trip Estimation Model Recreation Trip Estimation Model Bike Trip Models Estimate change in bike travel New Annual Bike Trips Due to bikeway investments (year 2035 vs. no build)
Methodology – Bikeway Trip Estimation Models Work Trip Model Recreational Trip Model NHTS (2009) LA & Orange Data Source ACS (2007 - 2011), LA County TravelPurpose Work Trips Strictly recreational (enjoyment/exercise) ModelType Logistic regression 2-Step: binary logit + linear regression • New Facilities • New Facilities • Local Factors • Local Factors • Binary Logit Model • Logistic Regression Model • ∆ Work Bike Trips • ∆ Other Utilitarian Trips • (4:1) • ∆ Persons who take at least 1 rec bike trip • ∆ # New Recreational Bike Trips • Linear Regression Model Benefits Calculation
Bicycle Work Trip Model • Estimated on census tract-level data using 2007-2011 ACS and land use/infrastructure data from LA County Key constants Logistic regression
Work Trip Model Sensitivity Tests • Scenario 1 – Increasing avg bikeway density to 2.5 mi/sq mi would raise bike commute share to 0.9% • Scenario 2 - Increasing to 5.0 mi/sq mi would raise bike commute share to ~1.2% • Reasonable results • Comparable to recent national study (Buehler & Pucher, 2012)
Rec Model - Data Sources and Processing • Data sources • 2009 NHTS person data (~10,000 L.A., Orange Co. residents) • Information on bicycling activity in past week • Sociodemographics and dependent variables • GIS Data processing • Facility density by tract • Proximity measures: • Number and length of facilities within 1, 2, 5, 10 miles
Binary Logit Model (n ~ 10,000): Propensity to Bicycle for Recreation
Linear Regression Model (n ~ 600):Number of Weekly Recreational Bicycling Trips
Summary of Recreational Model • Two-stage model • Identify individuals that bicycle for recreation • Compute the number of trips made by each individual • Key findings • Demographics – greatest impact • Bicycle facilities – also significant • Data limitations • Estimation dataset: NHTS person data (disaggregate) • Application dataset: census tract (aggregate) • GIS processing, zonal aggregation
Results • Benefits • Shows order-of-magnitude estimates based on best available data • Sensitivity tests showed reasonable results • For first time, cities can justify funding cycling projects based on local conditions • Relatively low cost implementation and ease of calculation • Limitations • Zonal aggregation misses connectivity/network issues • Limited by small sample sizes (e.g. only 600 rec trips) • More research needed to validate ‘off-model’ methods • For sketch purposes only • Opportunities to improve/expand functionality • Next step: census block zonal aggregation • Update pending TDM estimation & data collection results • Add other project types
Q&A CONTACT Michael Snavely Cambridge Systematics, Inc. Los Angeles, CA msnavely@camsys.com 213-612-7705 Robert Cálix Metro Los Angeles, CA calixr@metro.net 213-922-5644 THANKS Technical Advisory Panel Jennifer Dill Jeremy Raw Bill Stein David Ory Susan Handy Thomas Götschi Peter Furth
“Off-Model” Trip Estimation • Fixed-Rail Transit Station Bike Parking • Use actual fixed-rail transit boardings/alightings by jurisdiction • New secure parking (lockers or guards): • 0.5% change in access to transit modeshare) • i.e. of 5,000 wkday boardings, 25 new trips • New unsecure parking: • 0.25% change in modeshare • i.e. of 5,000 wkday boardings, 13 new trips • Worksite Bicycling Amenities • User specifies workers with access:
“Off-Model” Trip Estimation Example • Citywide Bikesharing Programs • Deployment Areas: tracts where (pop + jobs)/sq mi > 10,000 • Saturation Level: max 40 bikes / sq mi • Trips per bike per day: 2 • Prior mode share of bike trips: same (61% drive; 18% active) • Avg length of bike share trips: same as county avg: 2.0 mi • Source: Toole (2012)
Comparison with Recent National Study • Buehler and Pucher (2012) • City-level data from 90 of the 100 largest U.S. cities • Evaluated length of bike paths and lanes per capita vs. % commuting by bike • Elasticity of bike trips with respect to facility density: • 0.25 for paths, 0.31 for lanes • CS – Metro work trip model elasticity: • 0.13 to 0.15 from base • 0.31 for Scenario 1 to Scenario 2
Number of individuals that reported making a recreational bicycling trip in the previous week
Model Sensitivity • Greatest impact: Individual characteristics (sex, age, education) • Moderate impact: Bicycle facilities • Living near trail – greater propensity to bicycle for recreation • Getting to/from the trail is important too • No measurable impact on number of weekly trips • Low impact: household characteristics • Higher income and more children – fewer recreational bicycling trips • Indicators of a busy lifestyle?
Interpretation of Model Results • Propensity to bicycle for recreation • Sex and age – males more likely; flat rate by age until middle age, then starts to decline • Education – more educated are more likely • Bicycle facility variables – trails within 1 mile are preferred; getting to/from the trail is important too • Number of weekly recreational bicycling trips made • Sex – males ride more • Age – declines until middle age, then more trips made with age • Education – more educated ride more • Income – higher income ride less (too busy?) • Facility variables – tested but not significant
Recreational Bike Trip Model • Definition – three criteria: • Bicycle is used • Trip purpose is fitness, enjoyment, or both • Origin and destination are the same • E.g. , start at home, ride on bicycle trail, ride back home • Benefit impacts: • Public health only
NHTS Person Data Set Questionnaire • Questions on bicycling (in the past week) • How many times did you bicycle? • For what reasons (select from table)? • Data issues • Total bike trips split into estimated number by purpose • Possible confusion of purposes – e.g., reports “exercise” but is destined to the beach or gym