Download

1 / 9
140 likes | 362 Views
Introduction to Automation by Ed Red. Production Systems and Variety Low production (1 - 100 units per year) Medium production ( 100 - 10,000 per year) High production (10,000 - millions per year) Inverse relation between product variety and production quantity in a plant!.

E N D
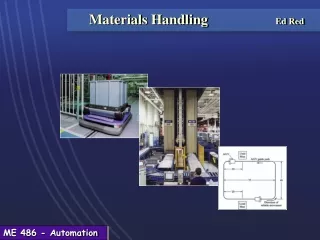
Introduction to Automation by Ed Red
Production Systems and Variety • Low production (1 - 100 units per year) • Medium production ( 100 - 10,000 per year) • High production (10,000 - millions per year) • Inverse relation between product variety and production quantity in a plant!
Plant layouts Process layout Fixed position Product Product line Cellular layout
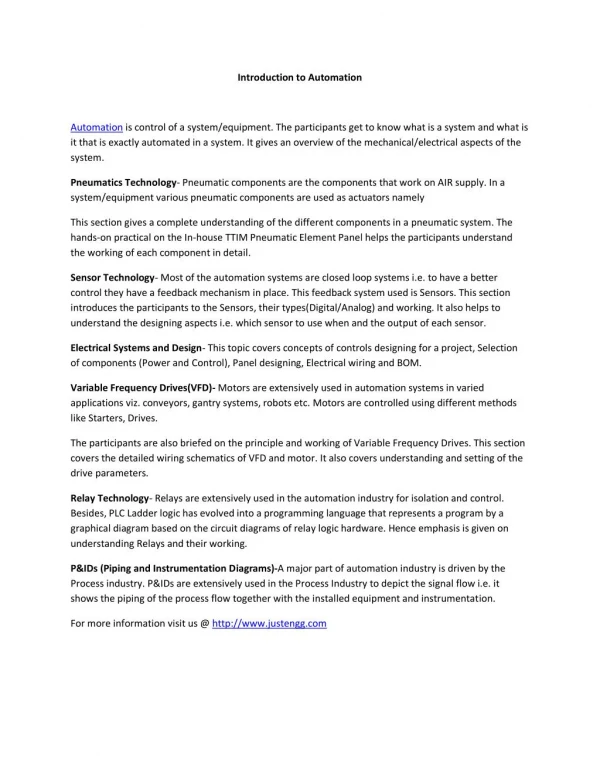
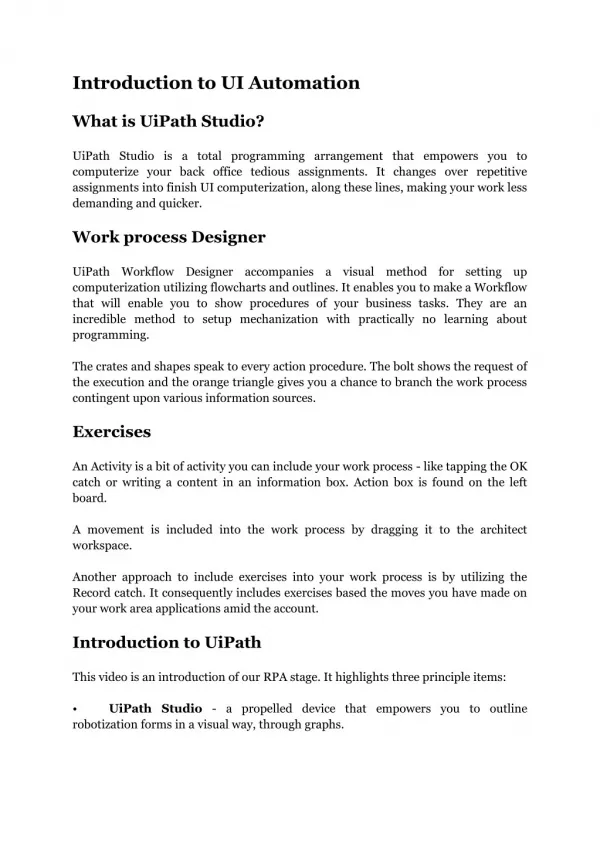
Howtoautomate? • The Product Support Systems • Business….sales, marketing, accounting, customer billing and support,…. • Product design….design cycle • Manufacturing planning…..process planning…schedule… material requirements… • Manufacturing control….shop floor control....material handling…..inventory control….quality….
Automation vs Manual Labor • To increase productivity and return on investment (to make money) • USA strategyUnderstand the processSimplify the processAutomate the process • Manual labor is necessary when task too complex for automation, or product is one of a kind, or demand is not consistent. • Reality - Automation is entering every segment of society ..it is not going away!
Manufacturing activity models Total # of parts produced by a plant per year is given by where npf = total # of parts made per year npj = number of parts in product j Qj = annual quantity of product style j P = total number of product styles
Manufacturing activity models If all parts produced in plant, then number of processing operations performed by plant per yearis where nof = total # of operation cycles per year nojk = number of processing operations for each part k, summed over the number of parts in product j (npj) Equation can be used to assess plant capacity!
Manufacturing activity models You should review the production rate equations, most of which will be applied later in material on conveyors, AGV’s, AS/RS, etc.
Automation Topic Areas • Robotics • Building Blocks • Material Handling • Networks, Signals and I/O